


- GMT market faces bearish pressure, hitting a 7-day low.
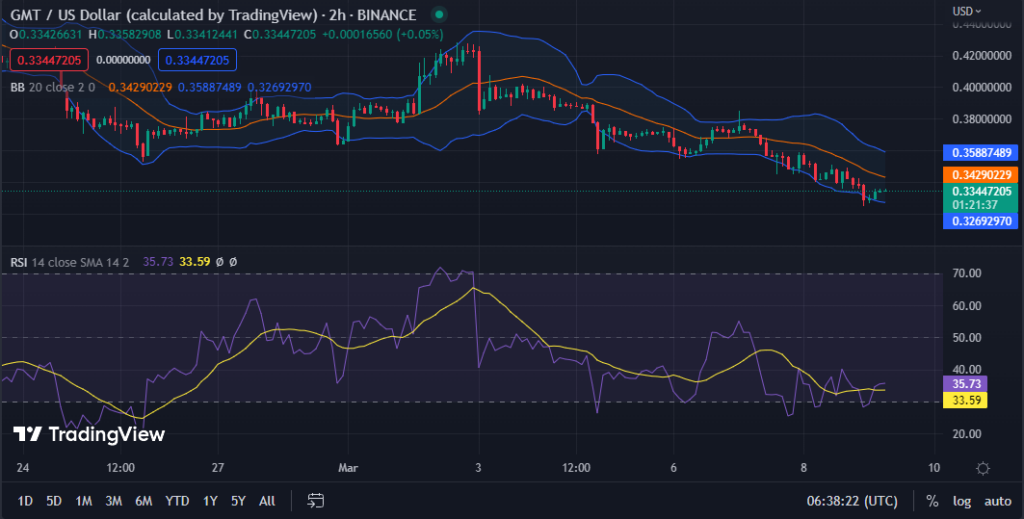
- Bollinger bands indicate low volatility and a likely downward trend.
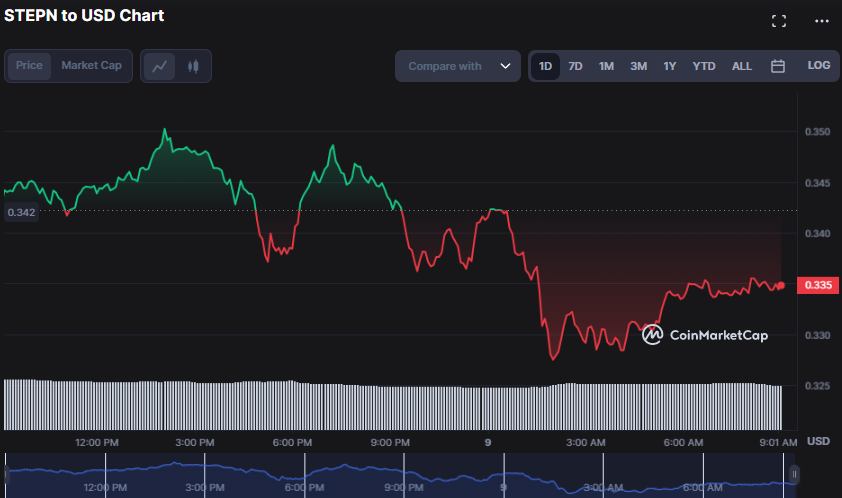
- Bull bear tussle fluctuates GMT price between $0.3271 and $0.3503.
Initial hours of the STEPN (GMT) market showed bullish momentum, but bulls could not rise through high intraday resistance at $0.3503. Due to this failure, bears drove the GMT price down to a 7-day low of $0.3271. Nonetheless, the market is still stable as it hangs around the $0.33 level, signaling the possibility of a comeback soon if positive momentum persists.
The pessimistic feeling hung over the GMT market as of press time, prompting the price to retrace by 2.66% to $0.3345.
As a result of the decline, market capitalization and 24-hour trading volume fell by 2.66% and 13.45%, respectively, to $200,874,908 and $63,188,532. This recession demonstrates that the STEPN market is very volatile and prone to rapid oscillations; therefore, investors should proceed cautiously and carefully watch the market before making any investment choices.
Bollinger bands are heading south on the GMT 2-hour price chart, with the upper band at 0.35880990 and the lower band at 0.32713040. This move indicates that the GMT price is now experiencing minimal volatility and may continue to move downwards towards the lower band.
Traders may consider selling or shorting the asset if it breaks below the lower zone, which might suggest a possible negative trend.
Nevertheless, since the price action produces a green candlestick as it approaches the signal line, traders may wish to wait to confirm the bearish trend before taking any action. This confirmation might come in the form of a red candlestick or a substantial drop in price below the lower band.
The Relative Strength Index (RSI) reading of 37.23 and recent rise above its signal line imply that, although the market is bearish, a positive turnaround is possible. This trend has potential if the price can break above the upper band and the RSI reading advances above 50.
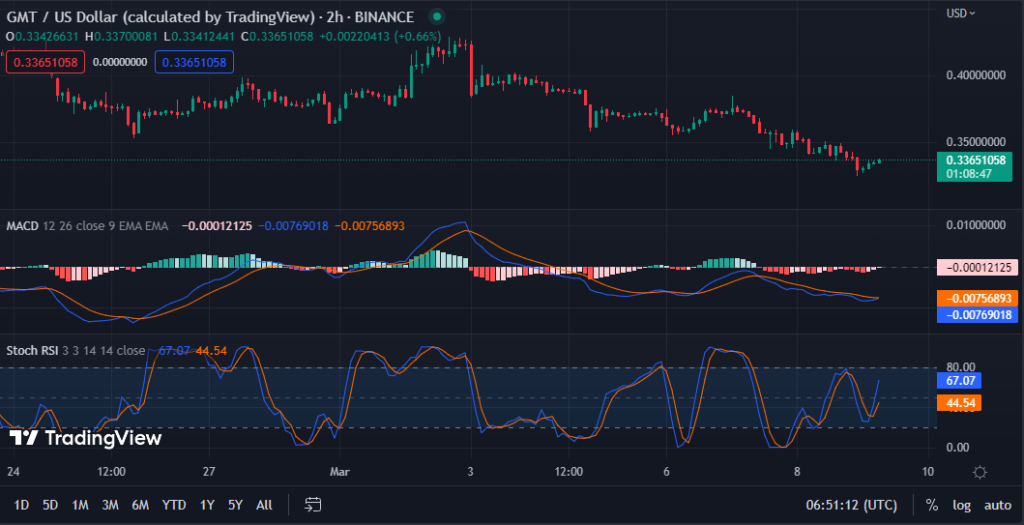
The bearish trend in the GMT market “may persist in the near term,” as the Moving Average Convergence Divergence (MACD) goes below its signal line and into the negative area with a reading of -0.00779152. Potential buyers may consider selling or waiting for a reversal in trend confirmation before buying.
The histogram motion in the negative zone shows that selling pressure is rising, which may cause the asset’s price to fall further. This movement may indicate that traders may consider shorting the asset or putting stop-loss orders to mitigate possible losses if they are long.
The negative momentum in the GMT market is now modest, with a stochastic RSI reading of 68.81 and going north, so traders should exercise care before making any hasty choices. This belief stems from a rising stochastic RSI value over 50, indicating that bullish momentum is building.
Investors should proceed cautiously in the volatile STEPN market as bearish trends persist, but positive momentum could signal a possible comeback.
Disclaimer: The views, opinions, and information shared in this price prediction are published in good faith. Readers must do their research and due diligence. Any action taken by the reader is strictly at their own risk. Coin Edition and its affiliates will not be liable for direct or indirect damage or loss.
Disclaimer: The information presented in this article is for informational and educational purposes only. The article does not constitute financial advice or advice of any kind. Coin Edition is not responsible for any losses incurred as a result of the utilization of content, products, or services mentioned. Readers are advised to exercise caution before taking any action related to the company.


