
- Santiment revealed in an X post today that GRT’s price has doubled since 19 October 2023.
- According to the post, there has also been a notable increase in transactions exceeding $100K.
- At press time, GRT was trading hands at $0.131 following a 24-hour loss of over 5%.
The Graph (GRT) has nearly doubled in price since 19 October 2023 and may continue to rise, according to the blockchain intelligence platform Santiment. In an X post published earlier today, Santiment noted that the altcoin has seen “major whale movement” with several new addresses being created on-chain.
Santiment also revealed that the mean dollar average line for GRT is moving down. This suggests that the cryptocurrency’s bullish trend may continue in the short term.
Further on-chain analysis shows that The Graph has recorded its highest amount of whale activity since February this year. According to Santiment’s post, 149 separate transactions exceeding $100K in value were executed on the project’s network. Meanwhile, 620 new addresses were created.
Despite the flourishing on-chain metrics, CoinMarketCap indicated that GRT suffered a 24-hour loss greater than 5%. Consequently, the altcoin was trading hands at $0.131 at press time. Despite this, GRT’s weekly performance remained deeply entrenched in the green zone at +25%.
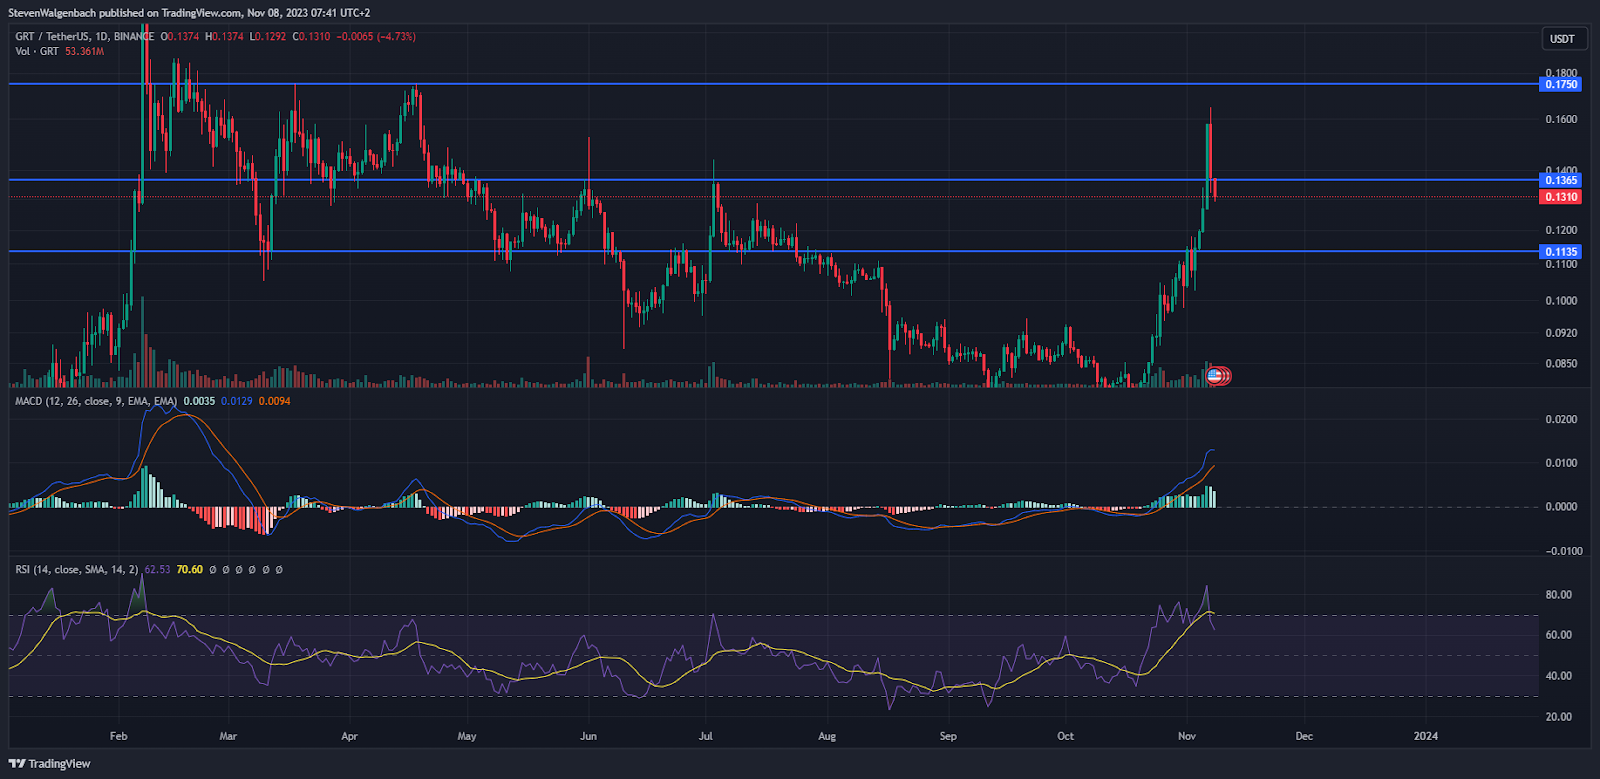
GRT’s price dropped below the key support level at $0.1365 over the past 24 hours. Should the cryptocurrency close today’s daily candle below this mark, then it may be at risk of correcting down to the $0.1135 support in the next few days. Conversely, a daily close today above $0.1365 could lead to GRT climbing to $0.1750 through the course of the next week.
Technical indicators suggested that a bearish scenario may be more likely to play out in the short term. At press time, the daily Moving Average Convergence Divergence (MACD) line was closing in on the MACD Signal line. This may be a precursor to a bearish trend reversal for GRT.
Meanwhile, the daily Relative Strength Index (RSI) line crossed bearishly below the RSI Simple Moving Average (SMA) line over the past 48 hours. This signaled that sellers had gained the upper hand against bulls on GRT’s chart, which may lead to GRT’s price continuing to drop in the next 24-48 hours.
Disclaimer: The information presented in this article is for informational and educational purposes only. The article does not constitute financial advice or advice of any kind. Coin Edition is not responsible for any losses incurred as a result of the utilization of content, products, or services mentioned. Readers are advised to exercise caution before taking any action related to the company.


