- Technical indicators on GRT’s daily chart suggested that buyers had exited the altcoin’s chart.
- The surge in GRT’s price propelled the altcoin’s value above the major $0.1365 resistance level.
- The price of GRT skyrocketed more than 7% over the past 24 hours and stood at $0.1429 at press time.
The Graph (GRT) saw its price jump more than 7% over the past 24 hours. As a result of the latest surge, the altcoin’s price stood at $0.1429 at press time, according to the cryptocurrency market tracking website CoinMarketCap.
As a result of the positive daily performance, GRT’s gain throughout the past 7 days was nudged deeper into the green zone. Subsequently, the cryptocurrency’s weekly performance stood at +32.41%.

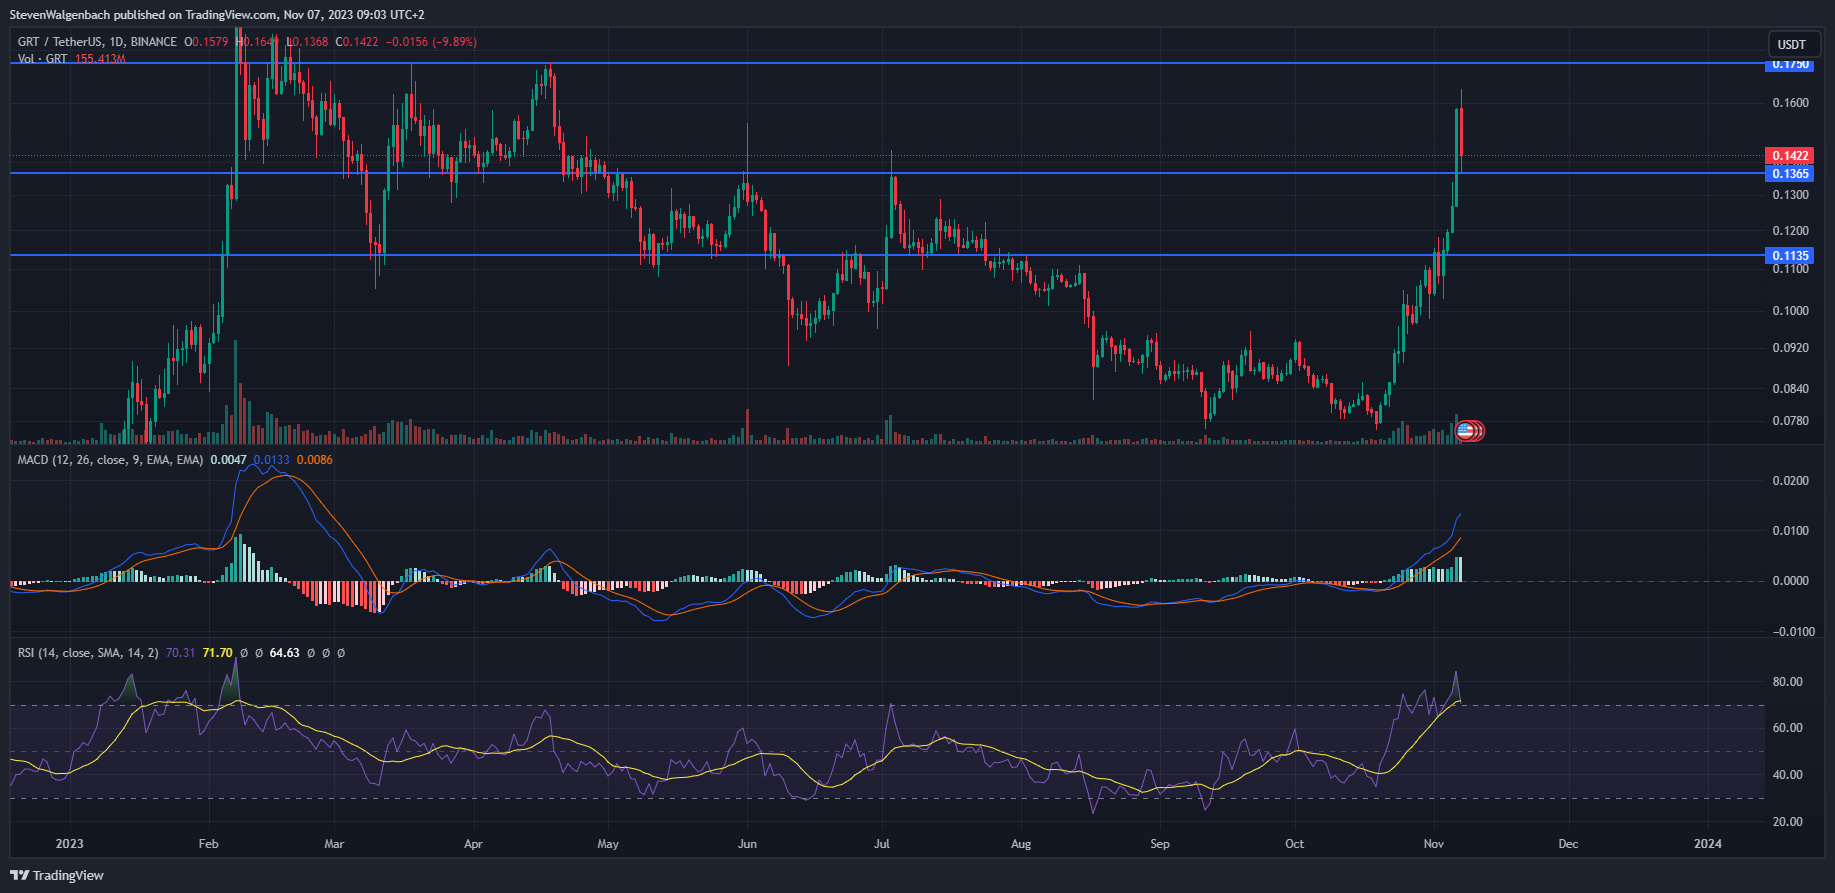
Daily chart for GRT/USDT (Source: TradingView)
GRT was able to blow past the $0.1365 barrier over the past 24 hours and continued to trade above this significant mark at press time. Following the break above this threshold, traders then attempted to boost the altcoin’s price above the subsequent resistance level at $0.1750 but were only able to elevate GRT to a high of $0.1649.
The opportunity to make a profit was too tempting for bears, as the altcoin’s price retraced from its 24-hour high to its current level. Currently, GRT’s price is resting on the previously breached level at $0.1365. Should it break below this support, then it may be at risk of falling to $0.1135 in the following few days.
Traders and investors will want to note that technical indicators on GRT’s daily chart show that buyers have started exiting the market. Firstly, the slope of the Moving Average Convergence Divergence (MACD) indicator was transitioning from positive to negative. This suggested that GRT’s price may undergo a bearish reversal soon.
In addition to the bearishness expressed by the MACD indicator, the daily Relative Strength Index (RSI) line crossed below the RSI Simple Moving Average (SMA) line over the past 24 hours. This could serve as a signal that sellers have gained the upper hand against bulls on GRT’s chart, and may attempt to push the cryptocurrency’s price down in the next 24-48 hours.
Disclaimer: The information presented in this article is for informational and educational purposes only. The article does not constitute financial advice or advice of any kind. Coin Edition is not responsible for any losses incurred as a result of the utilization of content, products, or services mentioned. Readers are advised to exercise caution before taking any action related to the company.


