


 Could Inflict Trend Reversal Above Downtrend Line")
- HT has been trading on a declining downtrend line but a positive reversal is coming.
- The HT prices have been trading on a bullish momentum in the past day.
- Bull’s strength might skyrocket HT prices.
Over the past year, the Huobi exchange saw a lot of FUD, which had negative effects on the users of the exchange. On the 24-hour price chart, Huobi Token (HT), the company’s native token, was relatively unaffected.
A positive trend has dominated the charts for the previous 24 hours, according to Huobi token. The token’s price has significantly increased; it is currently trading at $5.09, up 3.67% just in the last day. This bullish trend is being supported by the crypto market’s overall upbeat mood in the new year, which has been boosted by recent trading session wins.
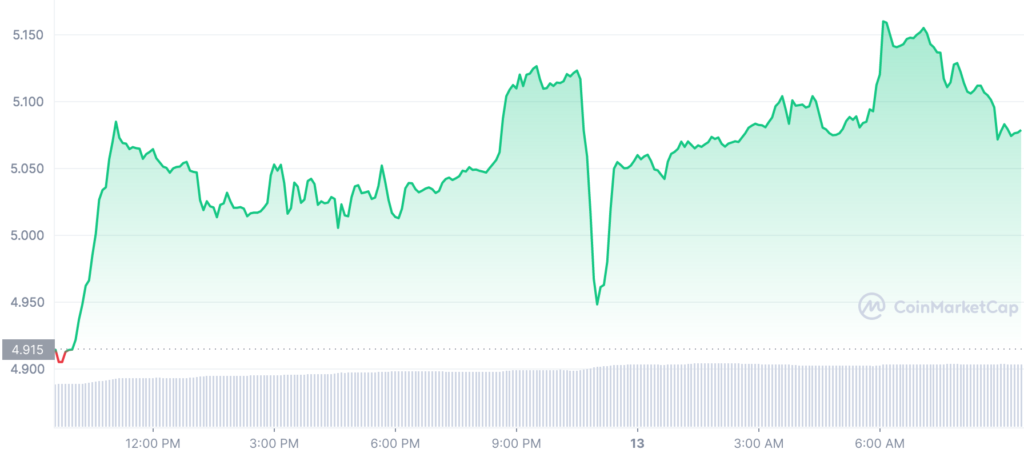
The increase in trading volume during the course of a day surged by 47.49% to $13,411,307 and the HT market capitalization rose by 3.64% to $825,726,842. The market’s strong performance is a result of its positive outlook and ample liquidity.
HT experienced a surge at the beginning of the new year, just like the other altcoins. It was trading at $5.0506 at the time of publication and was intersecting a downtrend line. Bulls may have additional leverage if there is a confirmed closure above the downtrend line. This could see HT propel upwards in the coming days to form an ascending trend pattern if the bulls will maintain their pressure.
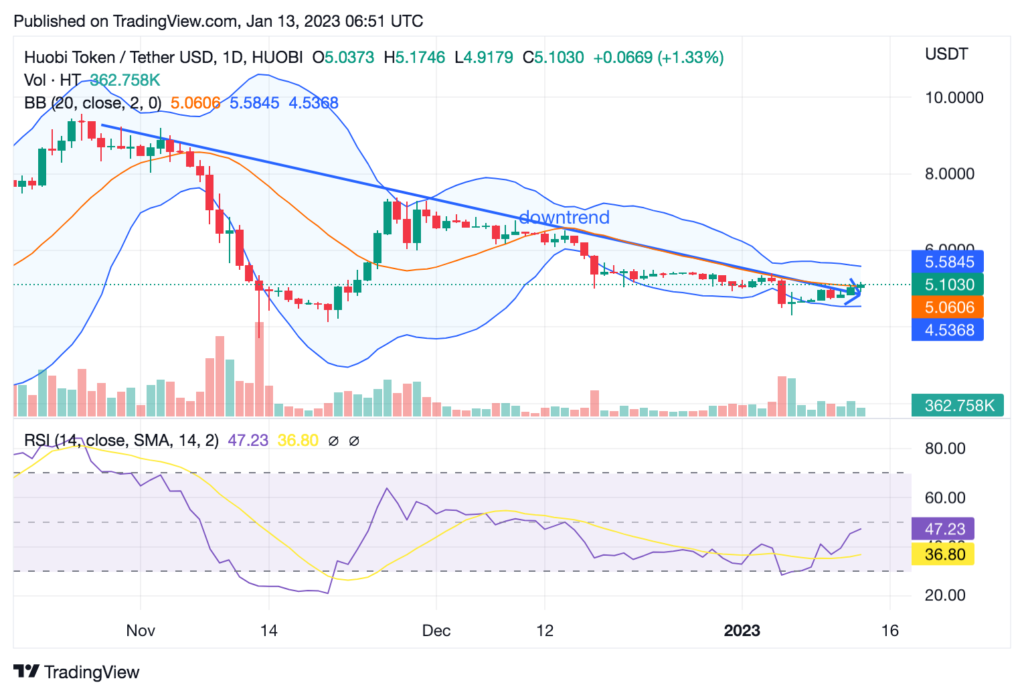
Following a significant gain between November 21 and November 25, 2022, HT entered a downtrend, which has continued as of this writing. Mid-December 2022 to early January 2023 saw a multi-week price consolidation for HT, which traded in the $5.0463 to $5.4595 range.
The $4.6110 support held the token back when it broke below the range. If the price moves back up from this support and turns the downtrend line into support, it could signal a trend change.
The Bollinger bands are moving toward each other indicating a bullish trend in the past few days. The RSI is currently at 47.23 thus showing it is not in the overbought nor the oversold zone therefore it has a potential for an upside.
The market is generally optimistic about HT, and it seems that the coin will increase more soon. Since a trend reversal is expected, it is probable that an upswing may occur soon. Prices are now being supported by the bullish trend line, and HT could continue to rise if the bulls can keep the market under their grip.
Disclaimer: The views and opinions, as well as all the information shared in this price analysis, are published in good faith. Readers must do their own research and due diligence. Any action taken by the reader is strictly at their own risk, Coin Edition and its affiliates will not be held liable for any direct or indirect damage or loss
Disclaimer: The information presented in this article is for informational and educational purposes only. The article does not constitute financial advice or advice of any kind. Coin Edition is not responsible for any losses incurred as a result of the utilization of content, products, or services mentioned. Readers are advised to exercise caution before taking any action related to the company.


