


- With a market cap of $198,055,743, ID tumbled by 27.24% over the week.
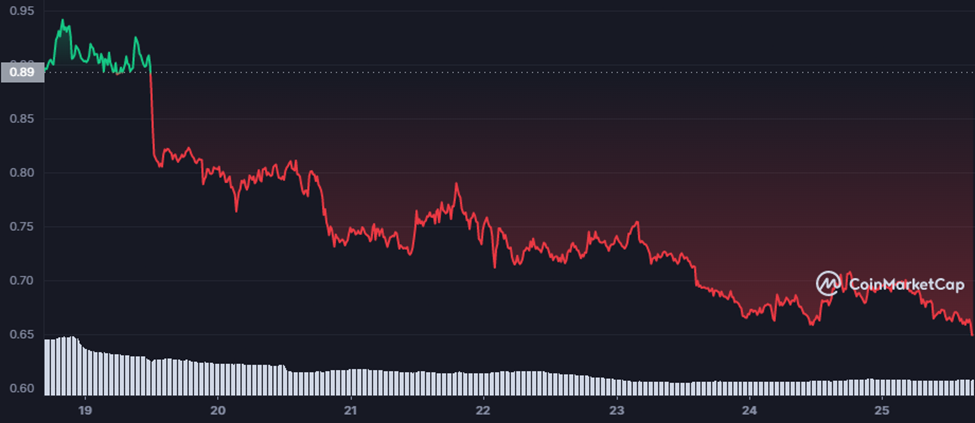
- ID, currently, is trading at $0.6502 after facing a fall of 6.50% in 24 hours.
- Indicators signal that ID would continue to face the bears’ attack for some time.
Many altcoins started this week facing the bears’ attack, including ID, the governance token of SPACE ID. With a market cap of $198,055,743, ID tumbled by 27.24% over the week. ID is currently trading at $0.6502 after facing a fall of 6.50% in the last 24 hours. However, ID still continues to remain among the most trending cryptocurrencies based on the market cap, according to CoinMarketCap. ID is trading within the red region, after plummeting over the week.
Observing the hourly chart, ID is continuously moving downwards away from the 200 MA indicator. ID’s trajectory could reach its candlesticks in the Weak Low region at 0.57208. Since the altcoin is below the 200MA, it could face bearish sentiment over the long run. The Weak Low will be a critical point for ID as it further determines whether the native token of SPACE ID would continue to be under the bears’ control. If ID breaks through the Weak Low region, it could continue to plummet to the Support level.
Looking at the indicators, the MACD line is below the signal line, confirming that ID would continue to fall. Moreover, the histogram model shows that red bars are gradually increasing rather than decreasing, further indicating that ID will continue to move toward its Weak Low trajectory. However, traders should note that ID could experience a trend reversal, thus, shifting its gears to race toward the Resistance level at $0.82412. If ID further trades upwards breaking through the Resistance level, the altcoin’s aim would be the Strong High level at $0.93716.
The RSI is currently valued at 32.15, indicating that ID is facing a weak trend as the value ranges from 50 to 30. The RSI is also below the SMA line, confirming that ID could face a bearish sentiment for some time. Providing hope for the traders, the RSI is pointing upwards, which could be a sign of a price reversal. However, the RSI needs to cross above the SMA to confirm ID’s bullish sentiment.
Ultimately, most of the indicators point out that ID could continue in the bullish sentiment. However, traders should be cautious of any opportunity for trend reversal.
Disclaimer: The views and opinions, as well as all the information shared in this price analysis, are published in good faith. Readers must do their own research and due diligence. Any action taken by the reader is strictly at their own risk, Coin Edition and its affiliates will not be held liable for any direct or indirect damage or loss.
Disclaimer: The information presented in this article is for informational and educational purposes only. The article does not constitute financial advice or advice of any kind. Coin Edition is not responsible for any losses incurred as a result of the utilization of content, products, or services mentioned. Readers are advised to exercise caution before taking any action related to the company.


