


- Solana faced a fall of 15.82% in just seven days, at the reporting time.
- The price of SOL is at $20.6 after witnessing a fall of 9.68% in just one day.
- Indicators give a strong indication that SOL could be under a bear’s grip.
Solana, also known as the “Ethereum-Killer” by the crypto community, has faced a fall of 15.82% in just seven days. According to CoinMarketCap, Solana’s market cap made it slip back to the eleventh position, just before DOGE, a meme-coin. SOL, the native crypto of the Solana network, is priced at $20.6 after witnessing a fall of 9.68% in one day, at the time of writing.
Also Read: Solana Price Prediction
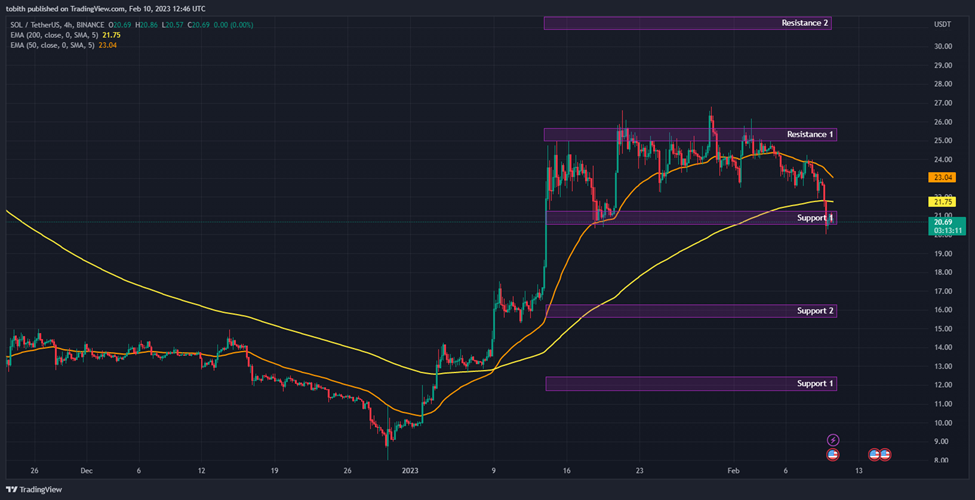
The four-hour chart of Solana shows that the price is below 200 EMA, which could indicate the start of a bear season. Moreover, the 50 EMA is moving toward the 200 EMA’s direction, if they intersect and form a death cross, this would confirm that SOL will be trapped in the bears’ lair for some time. While SOL had the most epic comeback, it is now struggling, as it remains in the Support 1 region of $20.
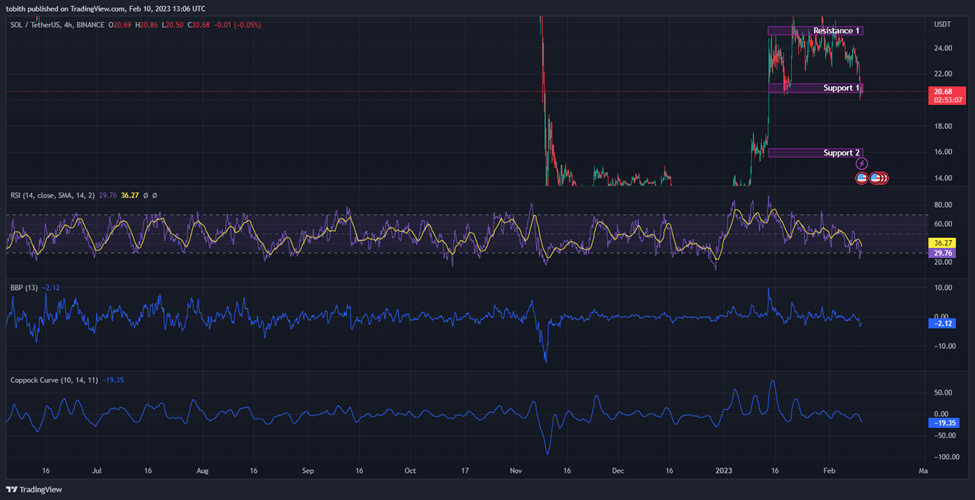
When looking at the Relative Strength Index (RSI), the RSI is valued at 29.69, which is the oversold region. The RSI in the oversold territory could indicate that SOL has been taken away by the bears, and the current movement of the indicator shows it could stay in the region for some time.
When diving further into the scene, another indicator shows that SOL’s path has been covered in bear’s tracks, with signs of struggle before its downfall. Bull Bear Power is valued at negative 2.12, indicating that the power remains in the bear’s claws.
Coppock Curve (CC), an early sign indicator, was also a witness to the SOL’s downfall, as it is valued at negative 19.13, a region below zero. CC also believes that SOL remains with the bears for some time, however, this could be a faulty signal if the price goes beyond the 200 EMA. If the price goes upwards and breaks beyond Support 1, then, SOL might recover at Resistance, the region it remained for some time.
However, indicators give strong indications that SOL will be in the bear season. Moreover, if the price falls even below Support 1, then, the death cross could be formed and SOL will fall in the deep pothole of Support 2.
Disclaimer: The views and opinions, as well as all the information shared in this price analysis, are published in good faith. Readers must do their own research and due diligence. Any action taken by the reader is strictly at their own risk, Coin Edition and its affiliates will not be held liable for any direct or indirect damage or loss.
Disclaimer: The information presented in this article is for informational and educational purposes only. The article does not constitute financial advice or advice of any kind. Coin Edition is not responsible for any losses incurred as a result of the utilization of content, products, or services mentioned. Readers are advised to exercise caution before taking any action related to the company.


