


- INJ market sees bullish momentum, with potential rebound plays.
- Strong buy signal for INJ/USD, but traders are cautioned to place a stop loss.
- INJ’s bullish momentum may rise with positive Chaikin Money Flow and Bull Bear Power.
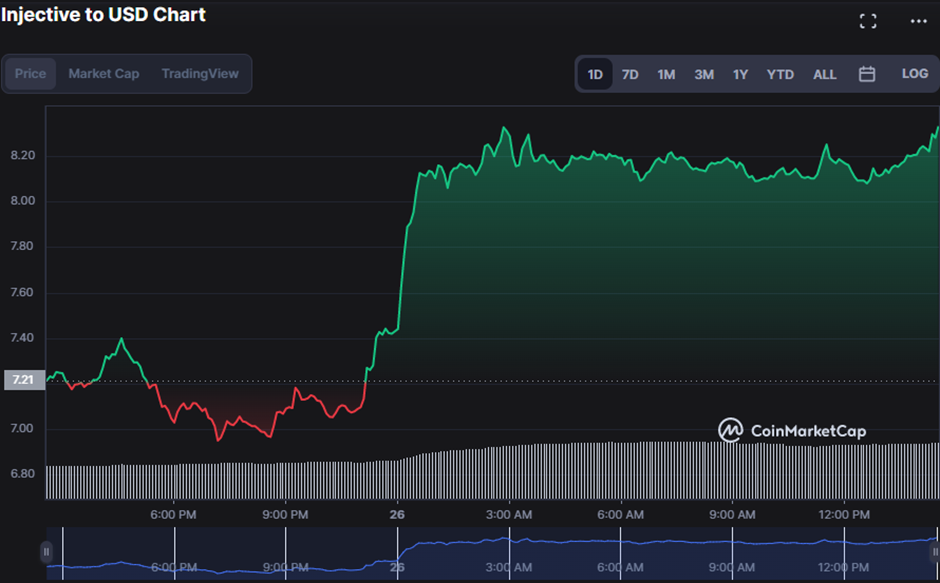
The INJ market had a major higher breakthrough, a trend reversal, and a rejection at $9. Traders are now looking for a potential rebound play between $7 and $9, with $5.75 giving another viable entry point.
In the previous 24 hours, the bull-bear battle has shifted the INJ price between $8.47 and $6.95 (resistance and support, respectively).
In the previous hour, bulls pushed the INJ price up 16.72% to $8.43, demonstrating the market’s buying frenzy. Consequently, the INJ market capitalization and 24-hour trading volume surged by 16.52% and 73.82%, respectively, to $674,049,573 and $231,554,979.
On the INJUSD price chart, the Technical Ratings indicator shows a strong buy signal with blue histograms, indicating that buying pressure is increasing. Consequently, traders may consider opening a long position on INJ/USD carefully and placing a stop loss to mitigate any risks.
The bullish momentum in INJ/USD is gathering strength, with a TRIX value of -21.98 and moving higher. If the TRIX goes above the “0” line, it might signify a probable buy signal and confirm the bullish trend in INJ/USD.
The Chaikin Money Flow rating of -0.04 and moving higher shows that the INJ bullish momentum may rise, signaling a possible buying opportunity for traders. A break into positive territory would reinforce the bullish trend and support a buy signal for INJ.
In support of this rising tide in the INJ market, the Bull Bear Power is showing positive tendencies at 1.643489. This pattern indicates that purchasing pressure exceeds selling pressure, signalling a likely upward advance in the INJ market.
The 4-hour price chart’s Relative Strength Index reading of 70.28 indicates an overbought market scenario, which may result in a short-term price corrective before the probable upward surge. However, this level does not always suggest an impending sell-off, as strong bullish momentum might continue to drive prices higher despite the overbought state.
In conclusion, the INJ market shows bullish tendencies, with potential rebound plays between $7 and $9. Traders should watch for buy signals and be cautious of overbought scenarios.
Disclaimer: The views, opinions, and information shared in this price prediction are published in good faith. Readers must do their research and due diligence. Any action taken by the reader is strictly at their own risk. Coin Edition and its affiliates will not be liable for direct or indirect damage or loss.
Disclaimer: The information presented in this article is for informational and educational purposes only. The article does not constitute financial advice or advice of any kind. Coin Edition is not responsible for any losses incurred as a result of the utilization of content, products, or services mentioned. Readers are advised to exercise caution before taking any action related to the company.

: What Happens If You Use an Unlicensed Platform?")


