


 Price Prediction 2026-2050: Will ICP Hit $10 Soon?")
- Bullish ICP price prediction for 2026 ranges from $6 to $8.
- ICP could hit $10 in 2026 if Caffeine V3 adoption scales and Mission 70’s deflationary push takes hold.
- The bearish ICP price prediction for 2026 is $2.
Internet Computer has spent five years building one of the most technically ambitious blockchain networks ever created, and the market has spent five years ignoring it. At $3.10 in June 2026, ICP trades 99% below its all-time high despite leading every major blockchain in monthly transaction volume, shipping an AI development platform with real user growth, and locking in AWS infrastructure integration that no other Layer-1 has matched. That kind of disconnect between fundamentals and price does not last forever.
Table of contents
- What Is Internet Computer (ICP)?
- Internet Computer (ICP) Current Market Status
- Internet Computer (ICP) Price Prediction Overview
- Internet Computer (ICP) Price Prediction 2026
- Internet Computer (ICP) Price Prediction 2027
- Internet Computer (ICP) Price Prediction 2028
- Internet Computer (ICP) Price Prediction 2030
- Internet Computer (ICP) Price Prediction 2031
- Internet Computer (ICP) Price Prediction 2040
- Internet Computer (ICP) Price Prediction 2050
- Conclusion
- Frequently Asked Questions (FAQs)
What Is Internet Computer (ICP)?
Internet Computer Protocol is a Layer-1 blockchain developed by the DFINITY Foundation, launched in 2016 by cryptographer Dominic Williams. Where most blockchains handle only financial transactions, ICP runs entire applications, frontend, backend, and data, natively on decentralized infrastructure, with no reliance on AWS, Google Cloud, or Microsoft Azure.
The core building blocks are canisters, smart contracts that store data and execute code, organized across subnets that scale horizontally. Key features that set ICP apart:
- Chain Key Cryptography: ICP canisters interact directly with Bitcoin, Ethereum, and Solana without bridges
- Network Nervous System (NNS): On-chain governance DAO controlling protocol upgrades through staked neuron voting
- Caffeine: AI-native development layer that lets anyone build full-stack on-chain apps using plain language
- Internet Identity: Privacy-first authentication requiring no usernames or passwords
The ICP token is burned to purchase computation cycles, staked for NNS governance rewards, and used in SNS decentralization sales for projects launching on the network.
Internet Computer (ICP) Current Market Status
| Metric | Value |
| Price (June 3, 2026) | $3.10 |
| Market Capitalization | ~$1.7B |
| All-Time High | $750.73 (May 10, 2021) |
| All-Time Low | $1.98 (October 10, 2025) |
| Circulating Supply | ~553M ICP |
| 30-Day Transaction Volume | 6.5B (ranked #1 globally) |
| Network TPS | ~2,900 |
| Total Transactions Since Launch | 287B+ |
Internet Computer (ICP) Price Prediction Overview
| Year | Minimum | Average | Maximum |
| 2026 | $2 | $4 | $8 |
| 2027 | $3 | $8 | $15 |
| 2028 | $5 | $12 | $20 |
| 2030 | $8 | $20 | $40 |
| 2031 | $5 | $15 | $25 |
| 2040 | $30 | $80 | $200 |
| 2050 | $100 | $250 | $600 |
Internet Computer (ICP) Price Prediction 2026
Fibonacci Extension: Descending Channel Break Points to $5.13 Target
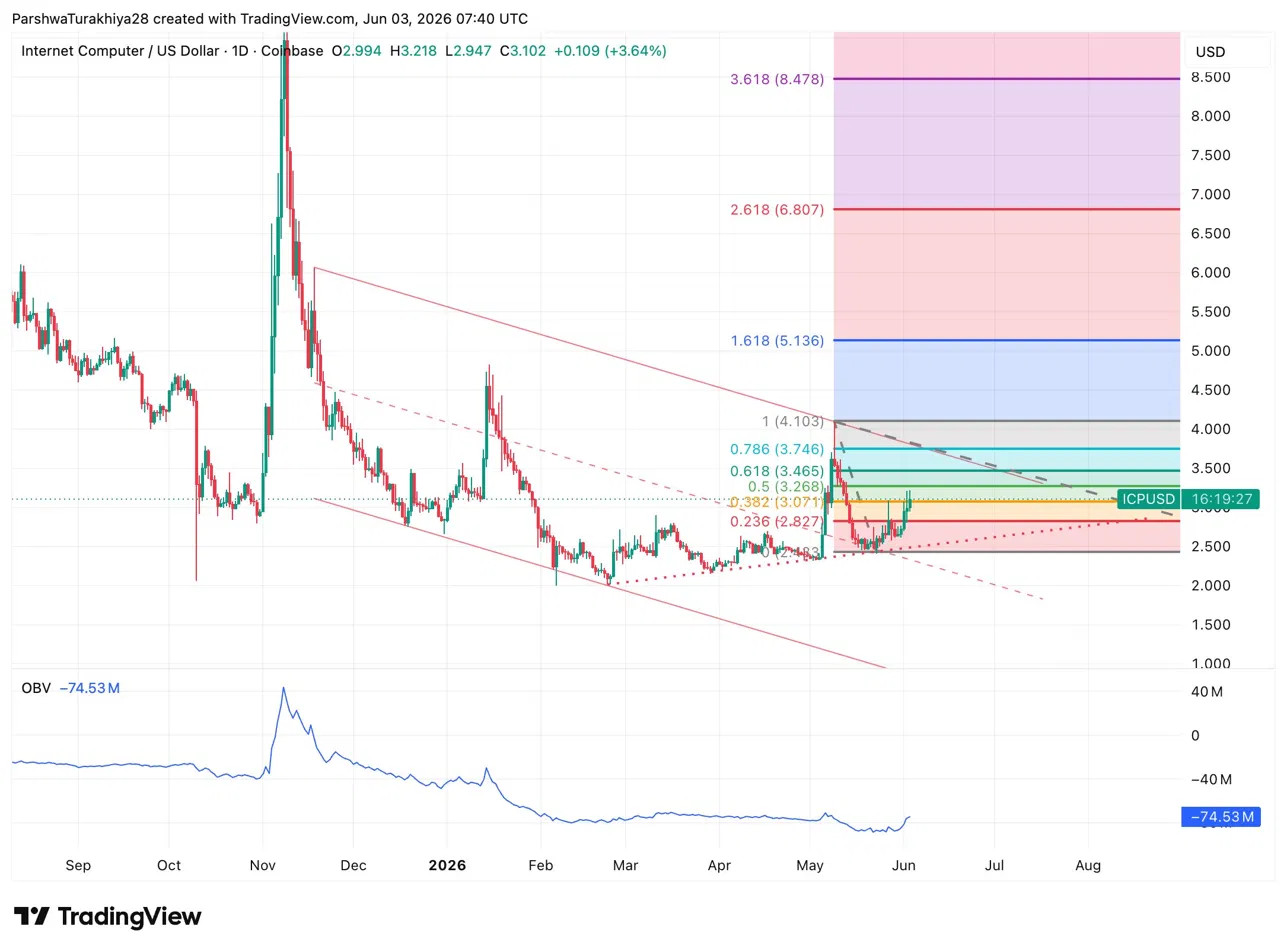
ICP trades at $3.10 on June 3, sitting just above the 0.382 Fibonacci level at $3.071 after breaking out of the descending channel that had contained price since the November 2025 spike to $9. The breakout candle confirmed the channel’s upper boundary as support on the retest, a bullish structure shift.
The Fibonacci extension is drawn from the swing low at $2.483 through the recent push to $3.218. The 0.5 Fib at $3.268 and the 0.618 at $3.465 are the immediate resistance levels to clear. Above that, the 0.786 at $3.746 and the 1.0 at $4.103 represent the first meaningful supply zone before the 1.618 extension at $5.136, which sits inside the blue target box on the chart. The 2.618 at $6.807 and 3.618 at $8.478 mark the outer bullish extensions.
The OBV at -74.53M is turning upward for the first time in months. OBV leading price to the upside is one of the earliest signals that genuine accumulation is underway rather than low-conviction speculation.
Internet Computer Key levels for 2026:
- Resistance: $3.268 (0.5 Fib), $3.465 (0.618 Fib), $4.103 (1.0 Fib), $5.136 (1.618 extension)
- Support: $3.071 (0.382 Fib), $2.827 (0.236 Fib), $2.483 (swing low), $2.00 (macro demand zone)
MACD and RSI: Fresh Bullish Cross With Room to Run
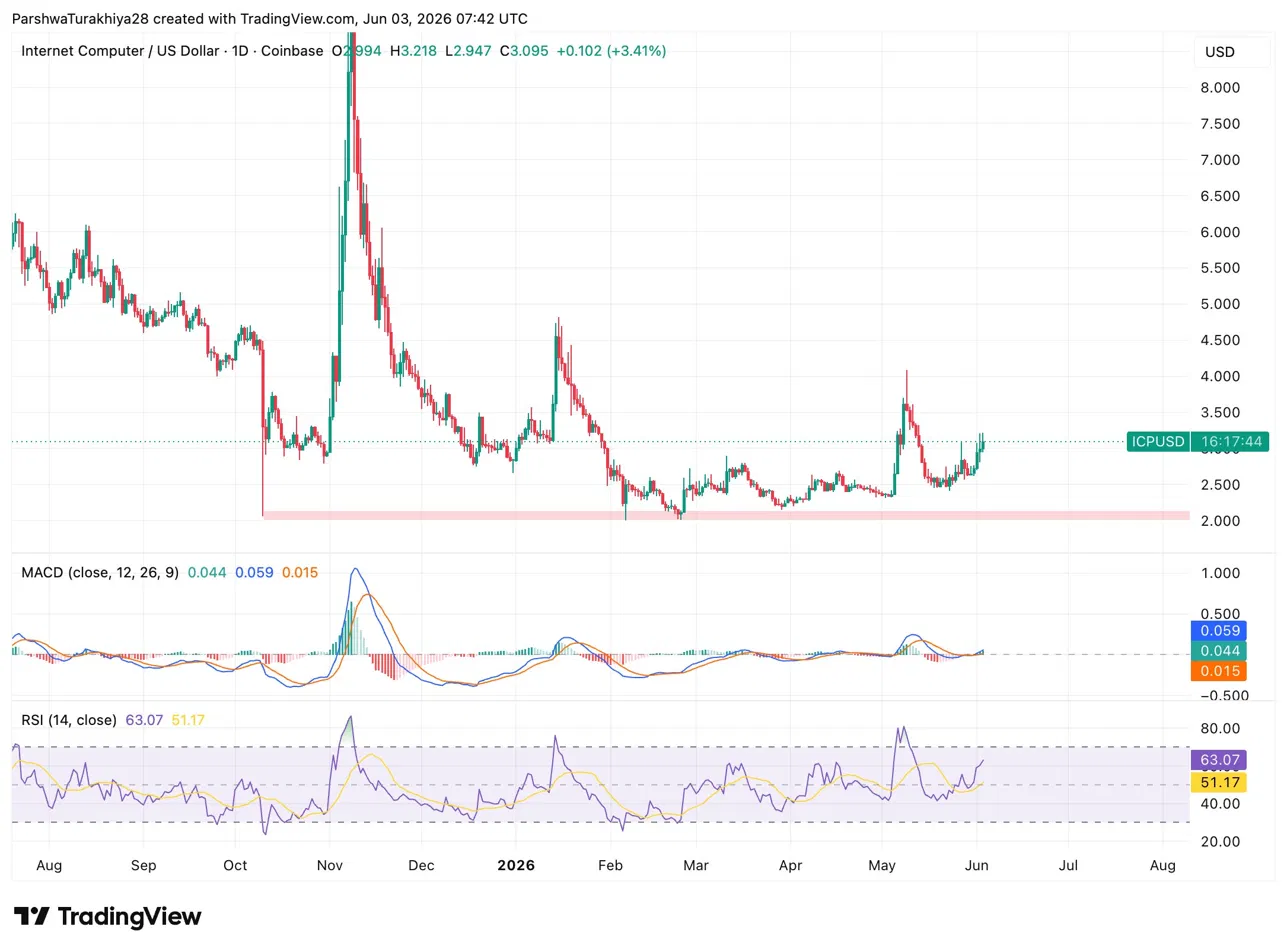
The daily MACD posted a fresh bullish cross with the MACD line at 0.059 above the signal at 0.044, and the histogram at 0.015 turning green. This is the first confirmed MACD bullish cross since the November 2025 spike, and it is developing from a low base, which gives it more durability than crosses that form in overbought conditions.
The RSI sits at 63.07, well above the 50 midline and approaching but not yet at the 70 overbought threshold. There is technical room for price to continue higher before momentum becomes extended. The RSI signal at 51.17 has crossed below the main line, confirming the momentum shift is genuine. The pink demand zone visible around $2.00 to $2.10 is the most critical macro floor, having held through the February 2026 low.
Weekly Chart: Above the 20 EMA for the First Time Since October 2025
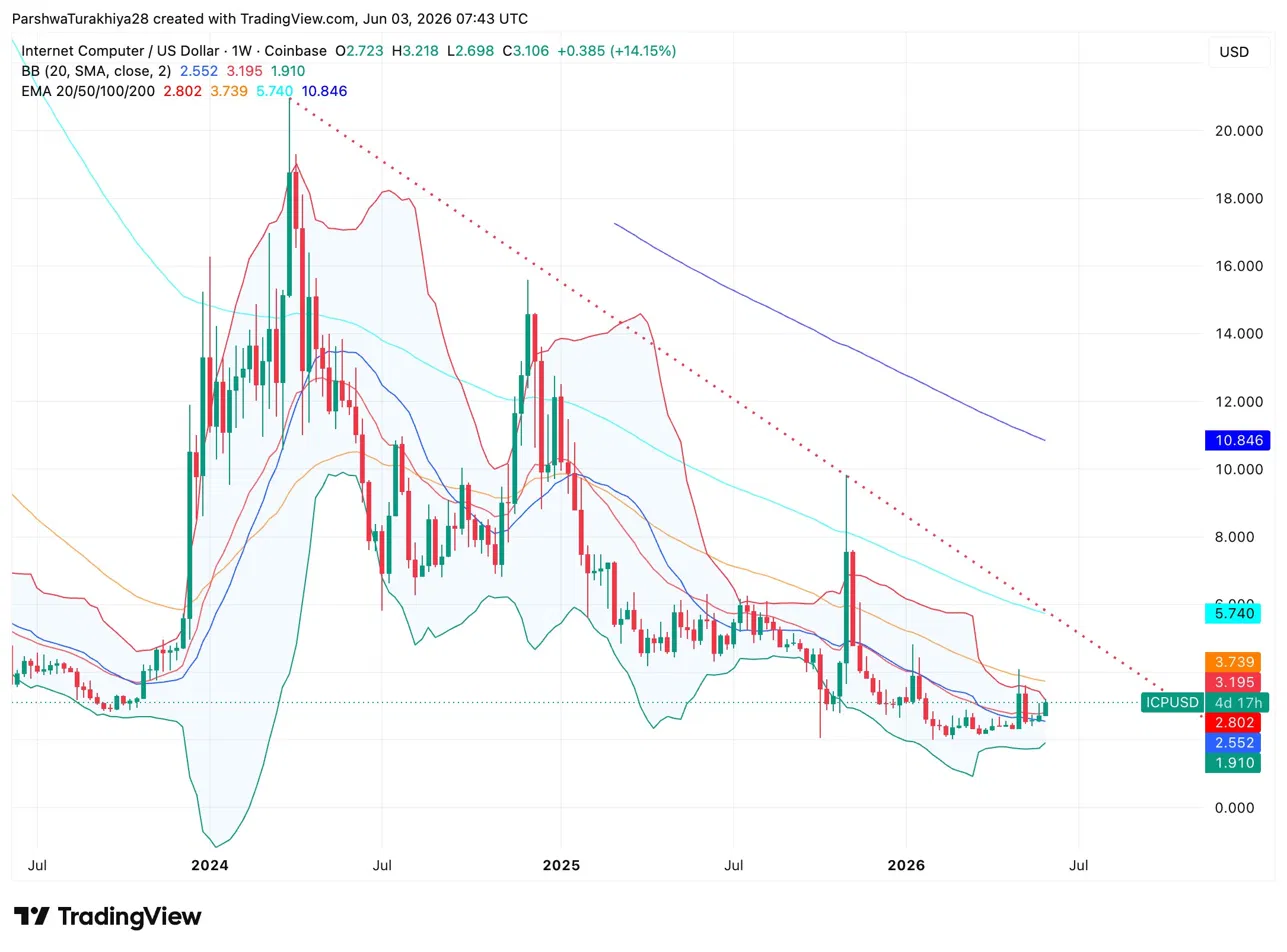
ICP/USD Weekly Bollinger Bands and EMAs (Source: TradingView)
The weekly chart shows ICP closing above the 20 EMA at $2.802 for the first time since October 2025, up 14.15% on the week. The Bollinger Band midline sits at $2.552 with the upper band at $3.195 acting as the first weekly resistance level that needs to be cleared on a closing basis.
The 50 EMA at $3.739, 100 EMA at $5.740, and 200 EMA at $10.846 are all stacked overhead, confirming the weekly trend is still bearish from the macro perspective. The dotted descending resistance trendline running from the 2023 highs sits near current price and needs a clean weekly close above it to signal the longer-term trend is turning. A weekly close above $3.739 would be the first confirmation that the 50 EMA has been reclaimed, opening the path toward $5.136 on the daily Fibonacci extension.
Internet Computer (ICP) 2026 Fundamental Catalysts
Three developments define ICP’s 2026 setup:
- Caffeine V3 lets users build and deploy full-stack on-chain applications using plain language, with all apps hosted permanently on ICP. Williams integrated Claude Code directly into V3 and the platform posted 20% month-over-month subscriber growth in its first cycle. Every app deployed burns ICP to generate computation cycles, tying platform growth directly to token demand.
- Mission 70 targets a 70% reduction in ICP token inflation by end 2026 by cutting supply-side emissions while Caffeine scales demand through cycle burns. For the first time in ICP’s history, sustained deflation is structurally achievable if Caffeine adoption continues.
- AWS Integration announced in March 2026 confirmed that ICP cloud engines will run over Amazon Web Services data centers, keeping full-stack on-chain apps resilient even in AWS failure scenarios. For enterprise buyers, that removes the single biggest reliability objection to on-chain infrastructure adoption.
ICP 2026 Forecast Table
| Scenario | Price Range |
| Bullish | $6 to $8 |
| Average | $3.50 to $6 |
| Bearish | $2 to $3 |
Internet Computer (ICP) Price Prediction 2027
By 2027, Caffeine V3’s subscriber growth will have had 12 to 18 months to convert into measurable on-chain usage and token burn volume. If Mission 70 delivers its 70% inflation reduction target by end 2026, ICP enters 2027 as a structurally deflationary asset for the first time in its history. The combination of shrinking supply growth and accelerating cycle burn demand from Caffeine creates the conditions for a sustained repricing.
The AI infrastructure narrative will be significantly more developed by 2027. ICP’s unique ability to execute AI agents fully on-chain, without relying on centralized cloud providers, positions it as the sovereignty layer for an agent economy that cannot trust Big Tech infrastructure. Dominic Williams’ claim that the network has 10 times more developers than all other networks combined, if validated by ecosystem metrics over the next 12 months, would fundamentally change how institutional capital views ICP’s TAM.
Related: Zcash (ZEC) Price Prediction 2025-2050: Will Zcash Hit $1,000 Soon?
On the Bitcoin cycle, 2027 is approximately 12 months post-April 2028 halving, putting it in the early post-halving accumulation phase where altcoin narratives begin to re-attract capital. ICP’s AI infrastructure story, if maturing on schedule, would enter that window with genuine utility metrics rather than speculative promise.
ICP 2027 Forecast Table
| Scenario | Price Range |
| Bullish | $10 to $15 |
| Average | $6 to $10 |
| Bearish | $3 to $5 |
Internet Computer (ICP) Price Prediction 2028
The April 2028 Bitcoin halving reduces block rewards from 3.125 to 1.5625 BTC. Every previous halving has produced a new all-time high within 12 to 18 months. Altcoins with maturing utility narratives in halving years have historically delivered their most explosive moves in the 6 to 18 months following the event.
By 2028, ICP’s Caffeine ecosystem will have had two full years of V3 deployment. If on-chain AI agent activity scales to meaningful levels, the cycle burn mechanism built into every ICP computation unit creates an entirely new demand driver that no prior altcoin has had in a halving environment. Enterprises running AI workloads on-chain via AWS-integrated ICP infrastructure represent a category of institutional adoption that operates on subscription and usage economics, not speculation.
The bearish scenario in 2028 centers on execution failure: if Caffeine does not achieve meaningful commercial deployment and Mission 70’s deflationary targets are missed, ICP remains a technically impressive but under-utilized platform competing against Ethereum’s Layer-2 ecosystem with superior developer mindshare.
ICP 2028 Forecast Table
| Scenario | Price Range |
| Bullish | $15 to $20 |
| Average | $10 to $15 |
| Bearish | $5 to $8 |
Internet Computer (ICP) Price Prediction 2030
ICP’s 2030 trajectory depends on whether AI-native on-chain computing becomes a mainstream enterprise category. The DFINITY Foundation’s vision of a full-stack on-chain AI Agent Economy is either prescient or premature depending on how the next four years of AI infrastructure development unfold. If autonomous AI agents need sovereign, tamper-proof, cloud-independent execution environments by 2030, ICP is positioned as the most technically prepared Layer-1 to provide it.
The transaction volume figures already visible in 2026 are structurally significant. Leading every major blockchain globally in 30-day transaction volume at 6.5 billion transactions while trading at $3 suggests either the market has not yet priced the utility, or the transaction volume does not generate sufficient fee pressure to drive token value. Mission 70’s cycle burn mechanism directly addresses the latter, and by 2030 the burn-to-inflation ratio should be decisively in favor of deflation if Caffeine scales.
At $20 in 2030, ICP would still be 97% below its 2021 all-time high of $750. The market would need to assign a fraction of its prior valuation to a network with meaningfully stronger fundamentals and a deflationary supply model.
ICP 2030 Forecast Table
| Scenario | Price Range |
| Bullish | $30 to $40 |
| Average | $15 to $30 |
| Bearish | $8 to $12 |
Internet Computer (ICP) Price Prediction 2031
Post-peak consolidation is a consistent feature of every crypto cycle. After a 2030 bull peak, ICP will likely compress into a range before the next halving cycle builds momentum in 2032. The duration and depth of any drawdown will depend on how much of the 2030 price is driven by genuine utility demand versus speculative premium, a balance that should favor ICP more than prior cycles given Mission 70’s structural deflation.
By 2031, the competitive landscape for on-chain AI infrastructure will be clearer. ICP’s first-mover advantage in fully on-chain AI execution is real but not guaranteed to be permanent. New entrants with stronger Ethereum ecosystem integration or superior developer tooling could narrow the gap meaningfully by this point.
ICP 2031 Forecast Table
| Scenario | Price Range |
| Bullish | $20 to $25 |
| Average | $12 to $20 |
| Bearish | $5 to $10 |
Internet Computer (ICP) Price Prediction 2040
By 2040, the question of whether AI agents operate in centralized cloud environments or sovereign on-chain infrastructure will have been answered by the market. If on-chain AI wins that debate, even partially, ICP’s position as the protocol that built full-stack on-chain AI execution in 2025 and 2026 gives it a durable first-mover claim on that ecosystem’s value.
The ICP token’s unlimited supply model is the primary long-term risk that makes conservative pricing appropriate relative to fixed-supply assets. The Mission 70 burn mechanism helps, but it is not a structural supply cap. If ICP’s burn rate consistently outpaces issuance through 2040, the effective monetary policy converges with deflation even without a hard cap. Whether it achieves that depends on how much commercial computing activity the network processes over 14 years.
At $80 average in 2040, ICP would represent roughly 11% of its 2021 all-time high adjusted for no inflation. That is a conservative recovery scenario for a network with genuine institutional integration and the longest on-chain transaction volume record of any smart contract platform.
ICP 2040 Forecast Table
| Scenario | Price Range |
| Bullish | $150 to $200 |
| Average | $60 to $150 |
| Bearish | $30 to $50 |
Internet Computer (ICP) Price Prediction 2050
By 2050, decentralized computing infrastructure will either be a core layer of global digital systems or a niche alternative to dominant centralized platforms. ICP’s technical architecture, specifically the ability to run entire applications permanently on-chain without any centralized component, is the most complete implementation of the decentralized internet vision that has been attempted in crypto. Whether the world wants that by 2050 is the only question the price answer depends on.
If decentralized AI and computing infrastructure commands even 1% of the global cloud market by 2050, a market currently valued in the hundreds of billions and growing rapidly, the utility demand flowing through ICP’s cycle burn mechanism would represent a fundamentally different order of magnitude than anything visible in 2026.
ICP 2050 Forecast Table
| Scenario | Price Range |
| Bullish | $400 to $600 |
| Average | $200 to $400 |
| Bearish | $100 to $150 |
Conclusion
Internet Computer sits at $3.10 in June 2026, 99% below its all-time high, leading every major blockchain in monthly transaction volume, and breaking out of a descending channel that defined its price action for eight months. The daily MACD just crossed bullish, the OBV is turning after a prolonged decline, and three simultaneous catalysts including Caffeine V3 growth, Mission 70’s deflationary mechanics, and AWS infrastructure integration have arrived in the same quarter.
Whether ICP hits $10 soon depends primarily on whether Caffeine’s user growth converts into on-chain cycle burn at a rate that outpaces token issuance. Mission 70 has the architecture to make that happen. The chart has the structure to support the move. What it needs now is execution.
Frequently Asked Questions (FAQs)
ICP hitting $10 in 2026 requires clearing the 1.618 Fibonacci extension at $5.136 and the 2.618 at $6.807 first. The catalysts that could drive a move toward $10 are Caffeine V3 commercial adoption scaling cycle burns, Mission 70’s deflationary impact becoming visible on-chain, and the weekly 50 EMA at $3.739 being reclaimed as support. None are confirmed yet but all three are in motion simultaneously heading into H2 2026.
ICP enters June 2026 with the highest 30-day transaction volume of any smart contract platform, a confirmed descending channel breakout, the Mission 70 deflationary mechanism active, AWS infrastructure integration in place, and Caffeine V3 posting real subscriber growth. The primary risks are token inflation outpacing burn demand if Caffeine adoption stalls, and Ethereum Layer-2 ecosystems capturing the AI development narrative before ICP’s tooling matures.
Our 2030 average target puts ICP between $15 and $30, with the bullish scenario reaching $40 if the on-chain AI Agent Economy achieves meaningful commercial deployment and Mission 70’s burn mechanism produces sustained deflation. The bearish case at $8 to $12 assumes ICP retains its current transaction volume leadership but fails to convert it into a commercially dominant AI infrastructure platform.
ICP’s architecture splits workload across more than 49 independent subnets, each running its own consensus rather than routing everything through a single execution layer. This design allows the network to process transactions at near-internet speed with horizontal scaling. The 6.5 billion transactions processed in May 2026 represent real network activity, over double Solana’s total for the same period, reflecting genuine throughput capacity rather than inflated metrics.
Our 2028 prediction for ICP ranges from $5 on the bearish side to $20 on the bullish side, with an average of $10 to $15. The April 2028 Bitcoin halving is the primary macro catalyst, with post-halving alt-season dynamics historically amplifying moves in utility-driven Layer-1 assets. Two years of Caffeine V3 deployment and Mission 70’s deflationary impact should be clearly measurable by 2028, making that year the first real test of whether ICP’s fundamentals translate into sustained price appreciation.
Disclaimer: The information presented in this article is for informational and educational purposes only. The article does not constitute financial advice or advice of any kind. Coin Edition is not responsible for any losses incurred as a result of the utilization of content, products, or services mentioned. Readers are advised to exercise caution before taking any action related to the company.


