
- Bitcoin breaks $84k resistance, showing technical action similar to past bull runs
- Key weekly signals (MA50 support, RSI >70) align strongly with prior cycle history
- Analysts now watch daily close above $88k as key confirmation for this pattern
Bitcoin’s current cycle shows strong similarities to the structural resets seen in both 2017 and 2021.
Key market indicators, like the relationship between Bitcoin and market volatility (BTC/VIX ratio) and the total crypto market capitalization on weekly charts, are showing alignments similar to those seen near previous important market shifts. These past major price adjustments acted as more than just downturns; they effectively reset the market before subsequent major upward trends began.
The Bitcoin Script: How Past Crashes Historically Set Up New Highs
Looking at the bigger picture, Bitcoin’s price history reveals a repeating multi-year structure. Typically, strong upward legs driven by widespread excitement eventually end in steep price drops (historically sometimes over 80%-85% from the peak).
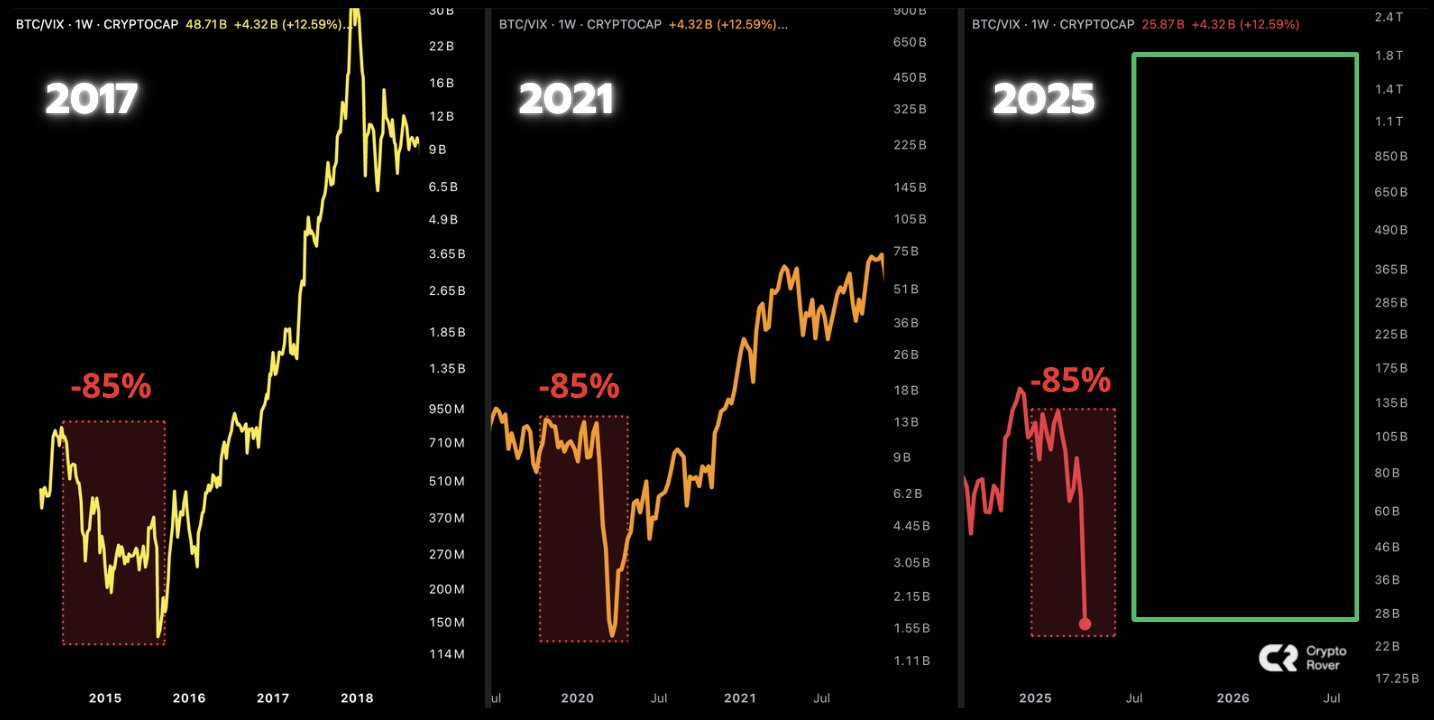
Following these major drops, were the quieter periods where, dedicated long-term investors used to steadily keep buying, laying the groundwork for the next significant climb. Examples include the lows reached around $200 after 2013, near $3,000 after 2017, and around $16,000 following the 2021 peak.
Related: Why Bitcoin Needs More Than Just LTHs Starting to Buy for a Real Rally
The 2025 structure now shows a familiar rhythm: after topping above $100,000, Bitcoin dropped sharply to below $80,000, driven by macroeconomic stress and heightened geopolitical risks. Importantly, this pullback has brought prices into zones where significant buying emerged in past cycles, potentially preparing the ground for the next upward trend.
Bitcoin Price Check: Can BTC Break Key Resistance to Confirm Pattern?
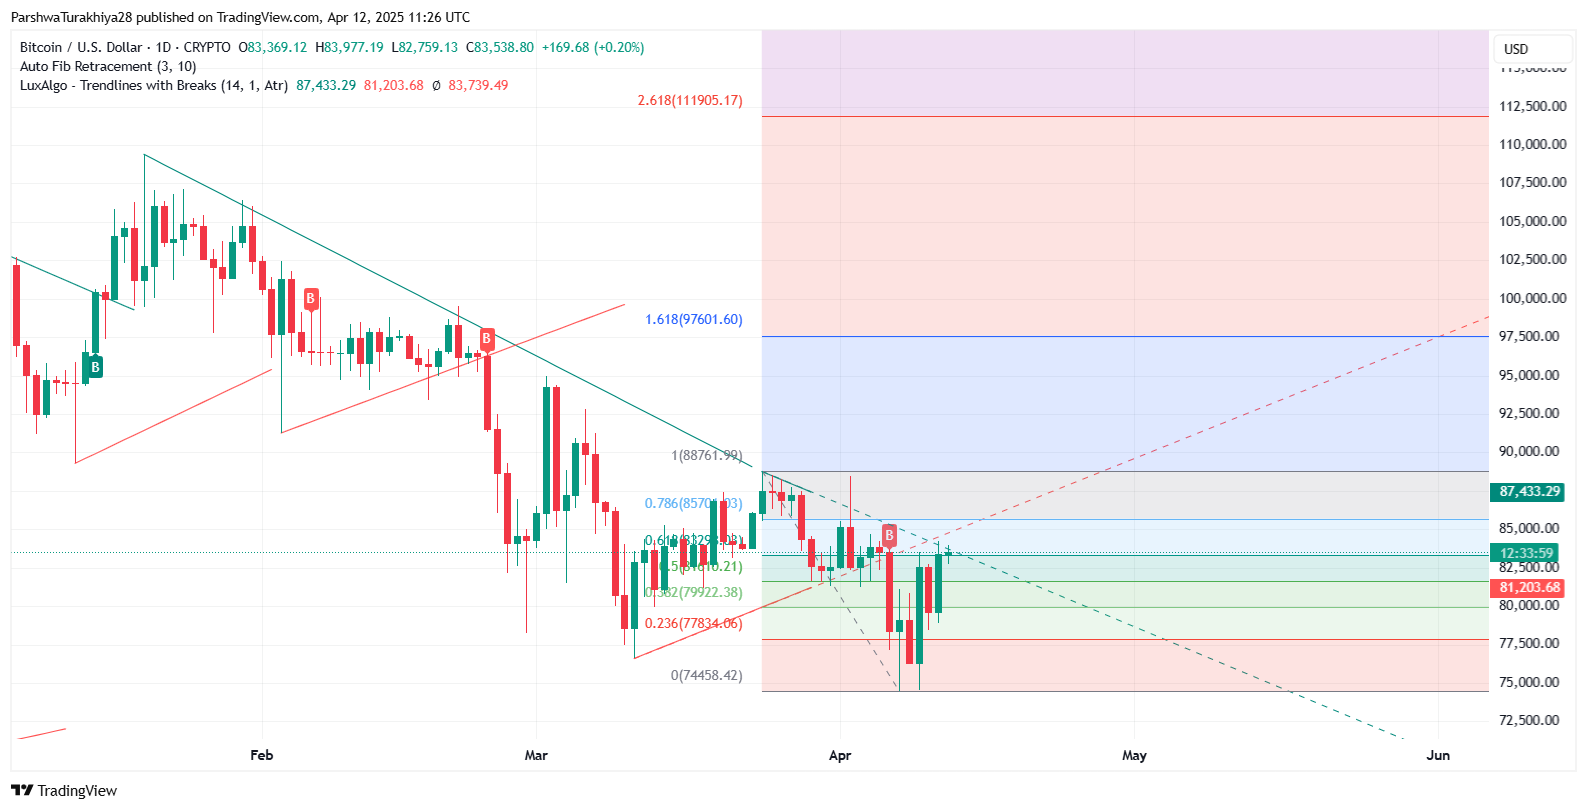
Bitcoin is currently trading near $85,050, working its way back up from recent lows of $74,436. On the 4-hour chart, the price has pushed above the descending trendline, now in the immediate overhead supply concentrated between $84,200 and $85,700.
The Relative Strength Index (RSI) sits around 59.58, suggesting moderate buying energy present without the market being excessively overheated. Fibonacci retracement levels, for instance, offer clearer targets: $85,700 (0.786), $88,700 (1.0), and $97,600 (1.618), with potential upside to $111,900 (2.618) if the trend continuation is confirmed.
A daily close above $88,000 stays as the critical threshold for bullish validation. On the downside, key support levels sit at $82,000, followed by $79,900 and $77,800.
If History Guides, Could Bitcoin Already Be Building Towards $150k?
The market structure, coupled with on-chain indicators and historical cycle patterns, suggests Bitcoin may be entering a pressure build-up phase ahead of another expansion.
However, confirmation will depend on volume, breakout strength above $88,000, and the sustained return of institutional buying. If history repeats, Bitcoin’s path to $150,000 might already be underway.
Disclaimer: The information presented in this article is for informational and educational purposes only. The article does not constitute financial advice or advice of any kind. Coin Edition is not responsible for any losses incurred as a result of the utilization of content, products, or services mentioned. Readers are advised to exercise caution before taking any action related to the company.


