 Price Could Skyrocket, According to This Chart Pattern")
- Elliott Wave analysis suggests Jasmy (JASMY) may see a bullish reversal.
- Key support levels are identified at $0.025 and $0.026.
- Potential resistance levels are at $0.038, $0.048, and $0.05.
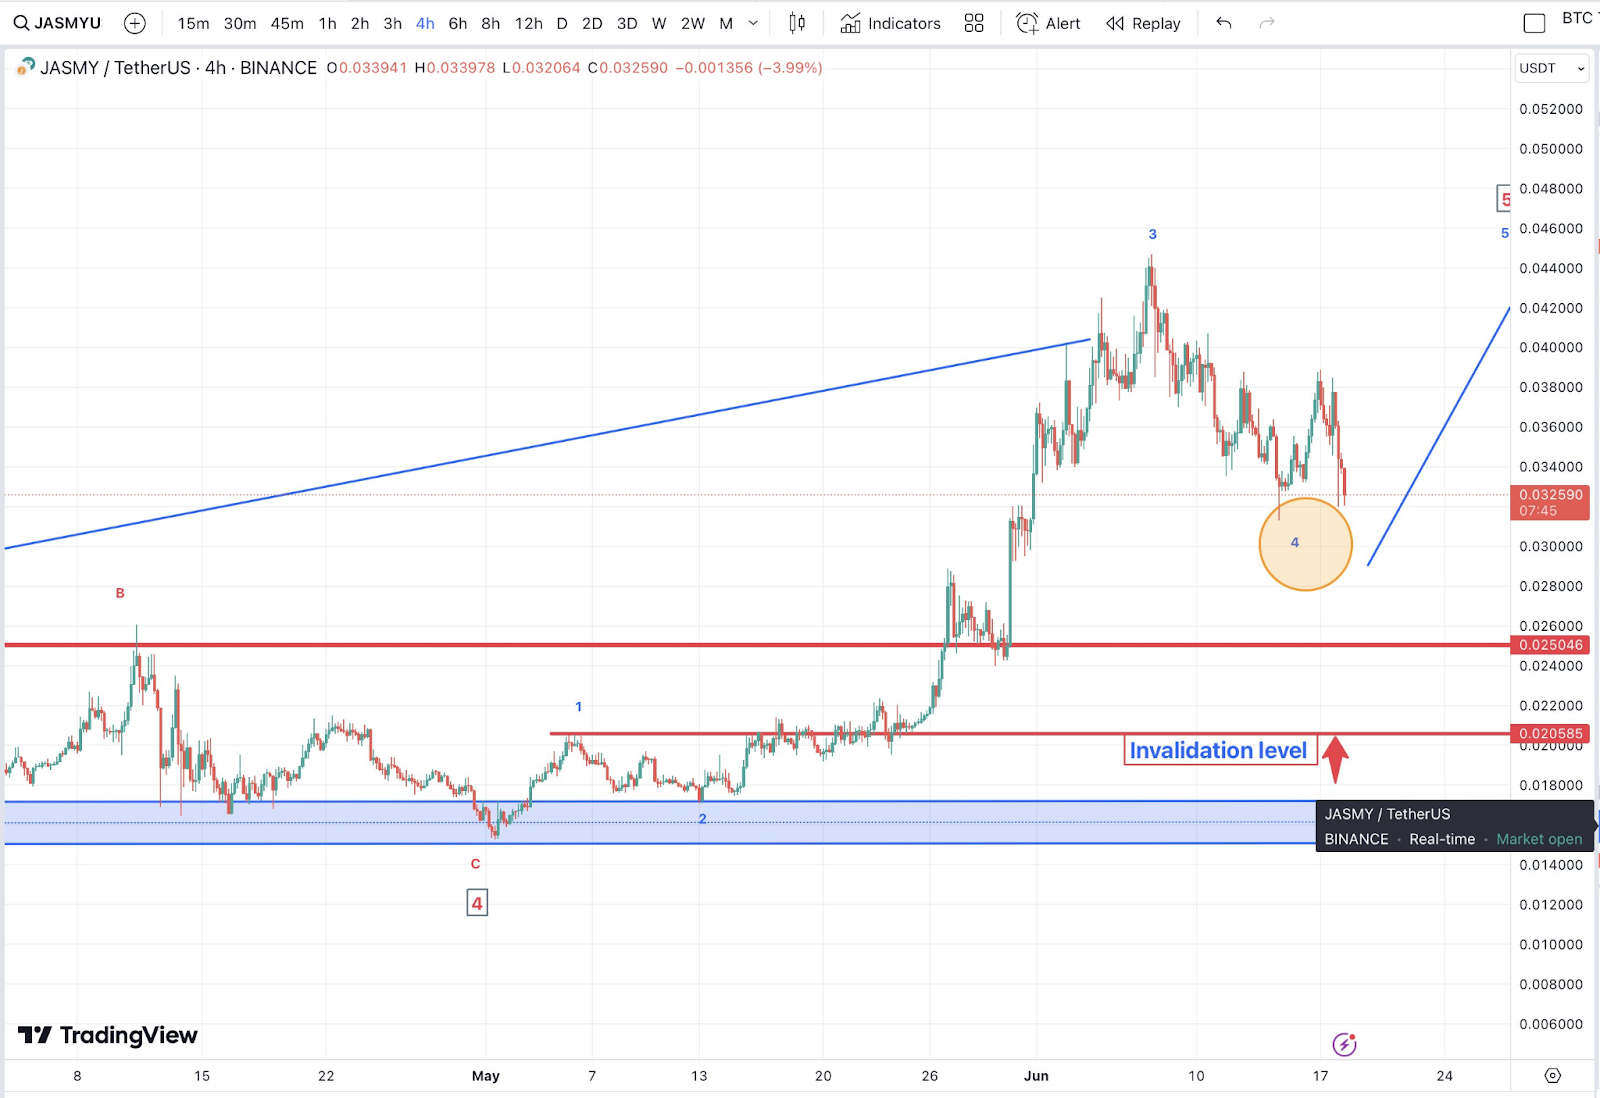
A 4-hour timeframe chart of JASMY/USDT analyzed using Elliott Wave Theory indicates potential bullish and bearish scenarios for the Jasmy (JASMY) token paired with Tether (USDT).
The current price movement suggests the possible continuation of an upward trend if specific conditions are met.
Source Matthew Dixon
The Elliott Wave Theory reveals a five-wave pattern in the JASMY/USDT chart. Waves 1, 2, and 3 have already completed, with Wave 3 peaking around $0.048. Wave 4 is currently in progress, indicating a correction phase. The price hovers around $0.032, marking a possible bottom for Wave 4. This price action suggests that the market might soon rebound and begin Wave 5.
The support level is around $0.025 to $0.026. This level is significant as it might prevent further declines. The resistance level is near $0.038. A breakout above this resistance might confirm the beginning of Wave 5.
In a bullish scenario, the price could reverse from the current level. If it follows the upward trend line, it might reach the next target around $0.05, completing Wave 5. Confirmation of Wave 5 would occur with a break above the previous high of Wave 3, around $0.048. This move would indicate a strong upward momentum.
Conversely, in a bearish scenario, the price might break below the upward trend line and the support level at $0.025. In such a case, the price could test the invalidation level around $0.021. A drop below this level would signal a bearish trend.
Matthew Dixon, CEO of Evai, provided insights on this analysis through his Twitter post. He emphasized:
“I am not making any prediction that JASMY will reach the invalidation level indicated. If this JASMY count is correct then I am just saying that theoretically, the price COULD dip near that level and NOT be invalidated. I DO NOT expect the price to go that low – just a possibility.“
The JASMY/USDT chart suggests a bullish outlook if the price remains above the upward trend line and the invalidation level.
Disclaimer: The information presented in this article is for informational and educational purposes only. The article does not constitute financial advice or advice of any kind. Coin Edition is not responsible for any losses incurred as a result of the utilization of content, products, or services mentioned. Readers are advised to exercise caution before taking any action related to the company.


 Price Prediction: Technicals Flash Mixed Signals — What’s Next?")

