


 Price Prediction 2024-2030: Will JTO Price Hit $5 Soon?")
- By 2029, JITO (JTO) may surpass its ATH of $6.00 due to increased adoption and technological advancements.
- JITO might even reach $8.50 by 2030, driven by innovative developments and market optimism.
- JITO could hit $15.00 by 2040 with global integration and regulatory support.
JITO (JTO) has been a focal point in the crypto world, capturing attention and sparking debates across the industry. The ongoing development and strategic partnerships have positioned JITO as a promising contender in the market, despite facing some uncertainties.
These dynamics have caused fluctuations in its price, leaving investors and analysts speculating about its future. Despite the turbulence, JITO has maintained a strong position in CoinMarketCap’s top 150, showcasing its resilience and potential.
As technological advancements continue and new integrations take place, the future of JITO hangs in the balance. Will it solidify its place as a market leader or face an uncertain destiny? Read more on our JITO price prediction to explore the potential paths JITO might follow as this unfolding saga continues.
Table of contents
- JITO (JTO) Real-Time Market Status
- What is JITO (JTO)?
- JITO (JTO) Current Market Status
- JITO (JTO) Price Prediction 2024-2030 Overview
- JITO (JTO) Price Prediction/Analysis
- Jito (JTO) Price Prediction: Where Will JTO be By December?
- JITO (JTO) Price Prediction 2025
- JITO (JTO) Price Prediction 2026
- JITO (JTO) Price Prediction 2027
- JITO (JTO) Price Prediction 2028
- JITO (JTO) Price Prediction 2029
- JITO (JTO) Price Prediction 2030
- FAQs
JITO (JTO) Real-Time Market Status
HTTP Request Failed... Error: file_get_contents(https://pro-api.coinmarketcap.com/v2/cryptocurrency/quotes/latest?slug=jito): Failed to open stream: HTTP request failed! HTTP/1.1 429 Too Many Requests
What is JITO (JTO)?
In the realm of digital currencies, JITO stands out as the innovative token of the JITO Network, an open-source blockchain built to streamline decentralized applications and smart contracts. This advanced technology facilitates seamless interactions and attracts developers aiming to build scalable and efficient solutions.
But the intrigue doesn’t stop there. The JITO Foundation leverages JITO and its network to power a sophisticated ecosystem. This platform transforms how decentralized applications, businesses, and organizations handle transactions, making each process faster, more efficient, and highly cost-effective.
JITO (JTO) Current Market Status
Over the past month, JITO has experienced a bullish rally, with its price climbing from a low of $2.50 to a high of $3.30. This positive trend is evident on daily and weekly charts, which recorded gains of 7.89% and 5.67%, respectively.
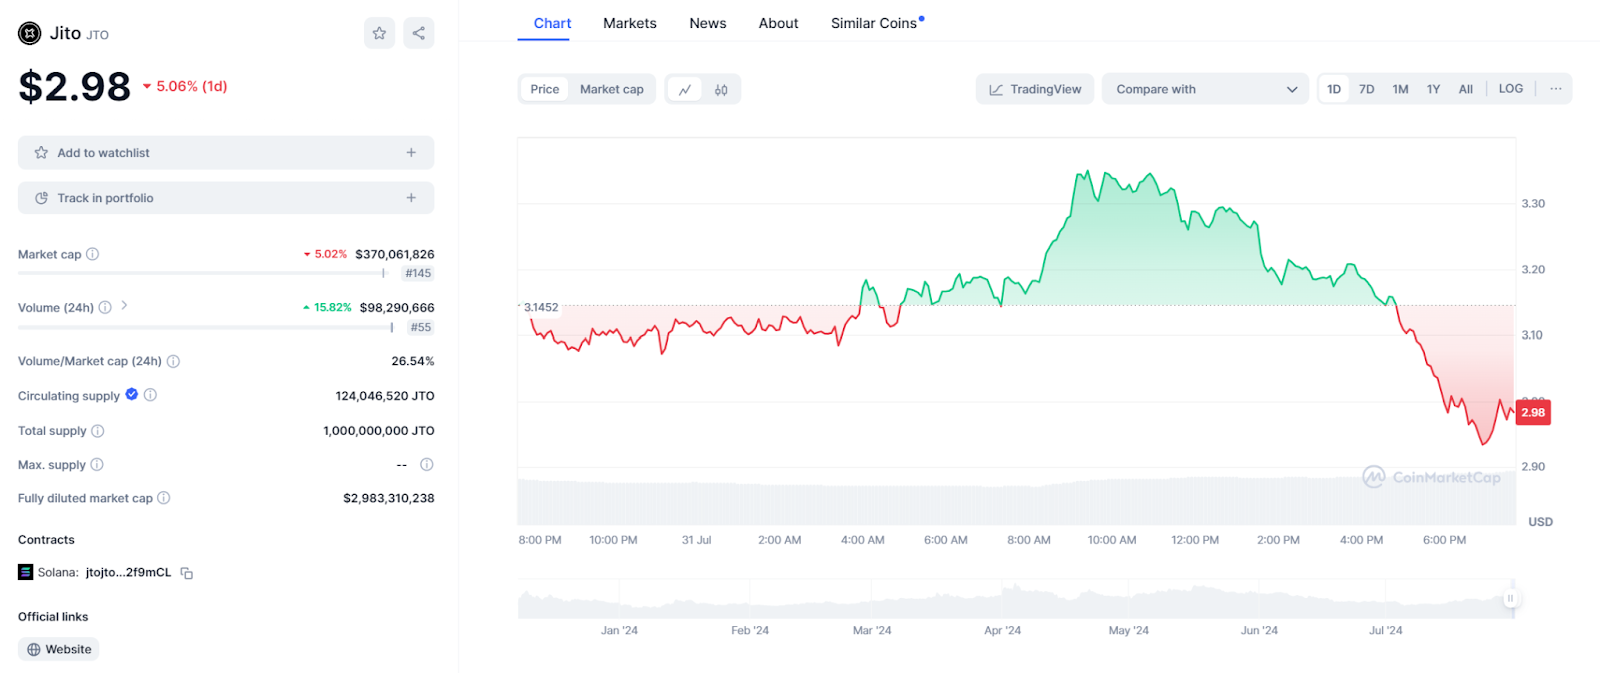
At the time of writing, JITO was valued at $2.98. As the 145th largest cryptocurrency, its market cap rose to $370 million, supported by a circulating supply of 124,046,520 JTO tokens. The trading volume for JITO also reflected this momentum.
In the past 24 hours alone, trading volume soared by 15.82%, reaching $98.29 million. This surge suggests increased interest and activity, driven by positive market sentiment and growing investor confidence in JITO.
JITO’s price range currently fluctuates between $2.90 and $3.30, with solid support at the $2.90 mark.
JITO (JTO) Price Prediction 2024-2030 Overview
| Price Prediction | Potential Low ($) | Potential High ($) |
| 2024 | $2.60 | $3.30 |
| 2025 | $2.80 | $3.12 |
| 2026 | $3.50 | $4.00 |
| 2027 | $4.00 | $5.00 |
| 2028 | $4.50 | $5.50 |
| 2029 | $5.00 | $6.00 |
| 2030 | $5.00 | $6.00 |
JITO (JTO) Price Prediction/Analysis
The recent fluctuations in JITO’s price have captivated traders, stirring curiosity and concern. Despite its recent struggles, a sense of anticipation about a potential rebound exists. Therefore, our analysis delves into JITO’s prospects, exploring what might lie ahead for the token.
Jito (JTO) Price Prediction: A Double Top Formation in Sight
Analyzing 4-hour Jito price charts, we see a double top pattern, indicating a potential bearish reversal. This pattern is characterized by two peaks (Top 1 and Top 2) at similar price levels, followed by a drop below the support level formed between the peaks. This support level has been broken, suggesting that the price might continue to fall towards the target zone marked in the chart.
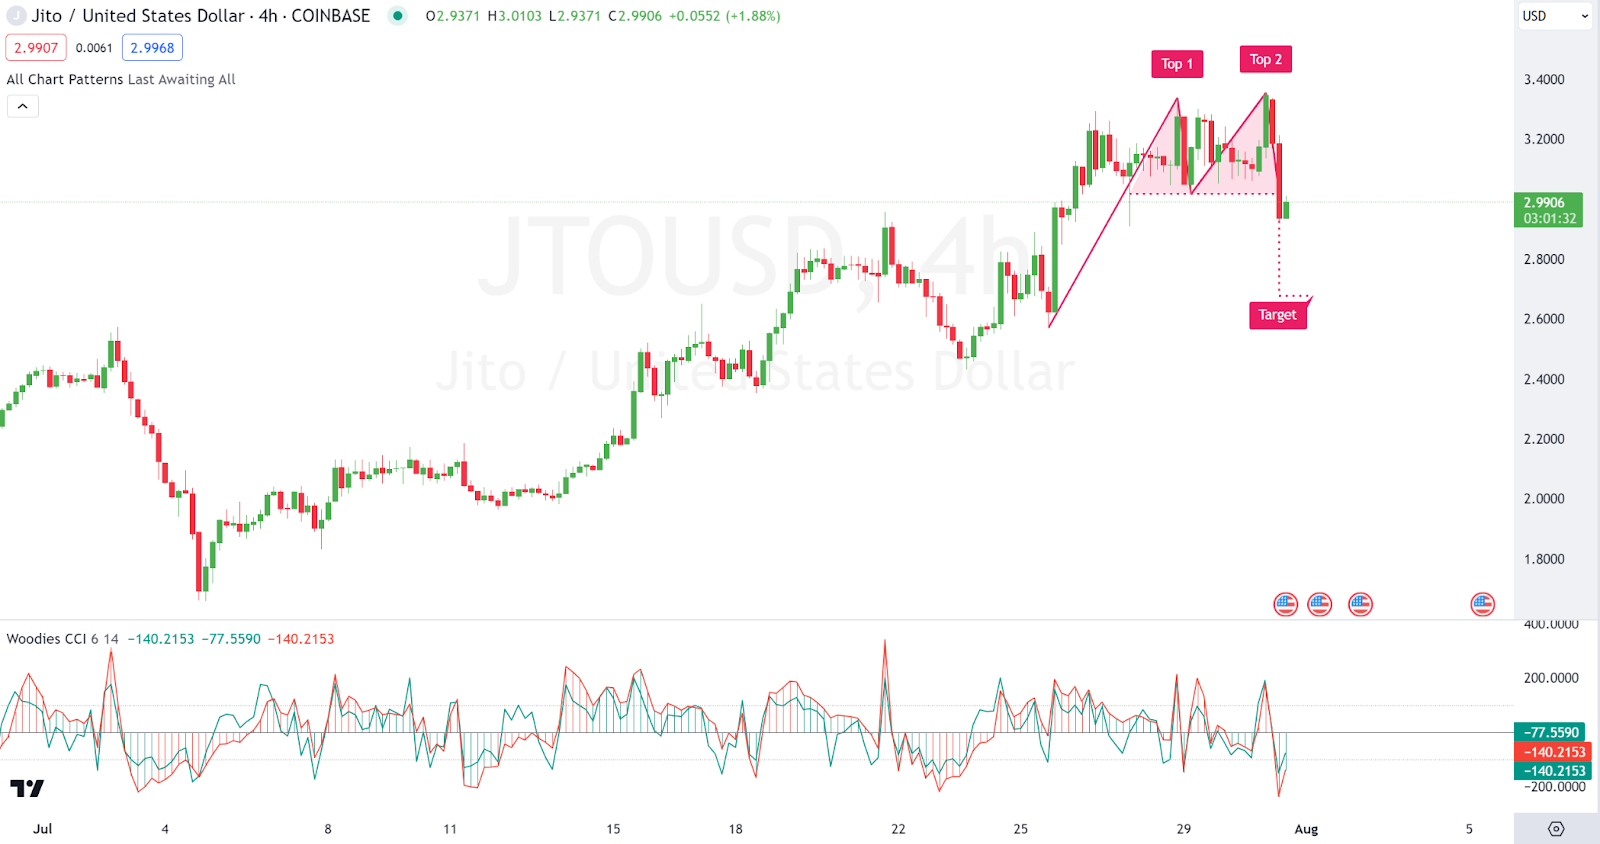
Looking at the short-term trajectory, Jito (JTO) is likely to see a decline towards the $2.60-$2.70 range in the short term as indicated by the target price on the chart. The key support level to watch is around $2.90. If this level is breached, the price might continue to fall towards the target. Resistance is expected around the $3.00-$3.10 range, where the price previously struggled to break higher.
On the other hand, looking at other technical indicators, we see the Woodies CCI shows bearish momentum with the CCI values below -100, indicating that the selling pressure is strong. This further supports the likelihood of a short-term decline.
Jito (JTO) Price Prediction: Support and Resistance
Analyzing two hour charts, we see that Jito (JTO) is likely to experience some volatility as it approaches the support level. If the price breaks below the support level of $2.90, we could see a further decline towards $2.70 or even lower. However, if the price holds above this support, it might rebound and attempt to retest the resistance level around $3.40. Given the recent price action and the highlighted support and resistance levels, traders should watch for any breakout below support or above resistance. A breakout on either side could signify the next major price move for Jito (JTO).
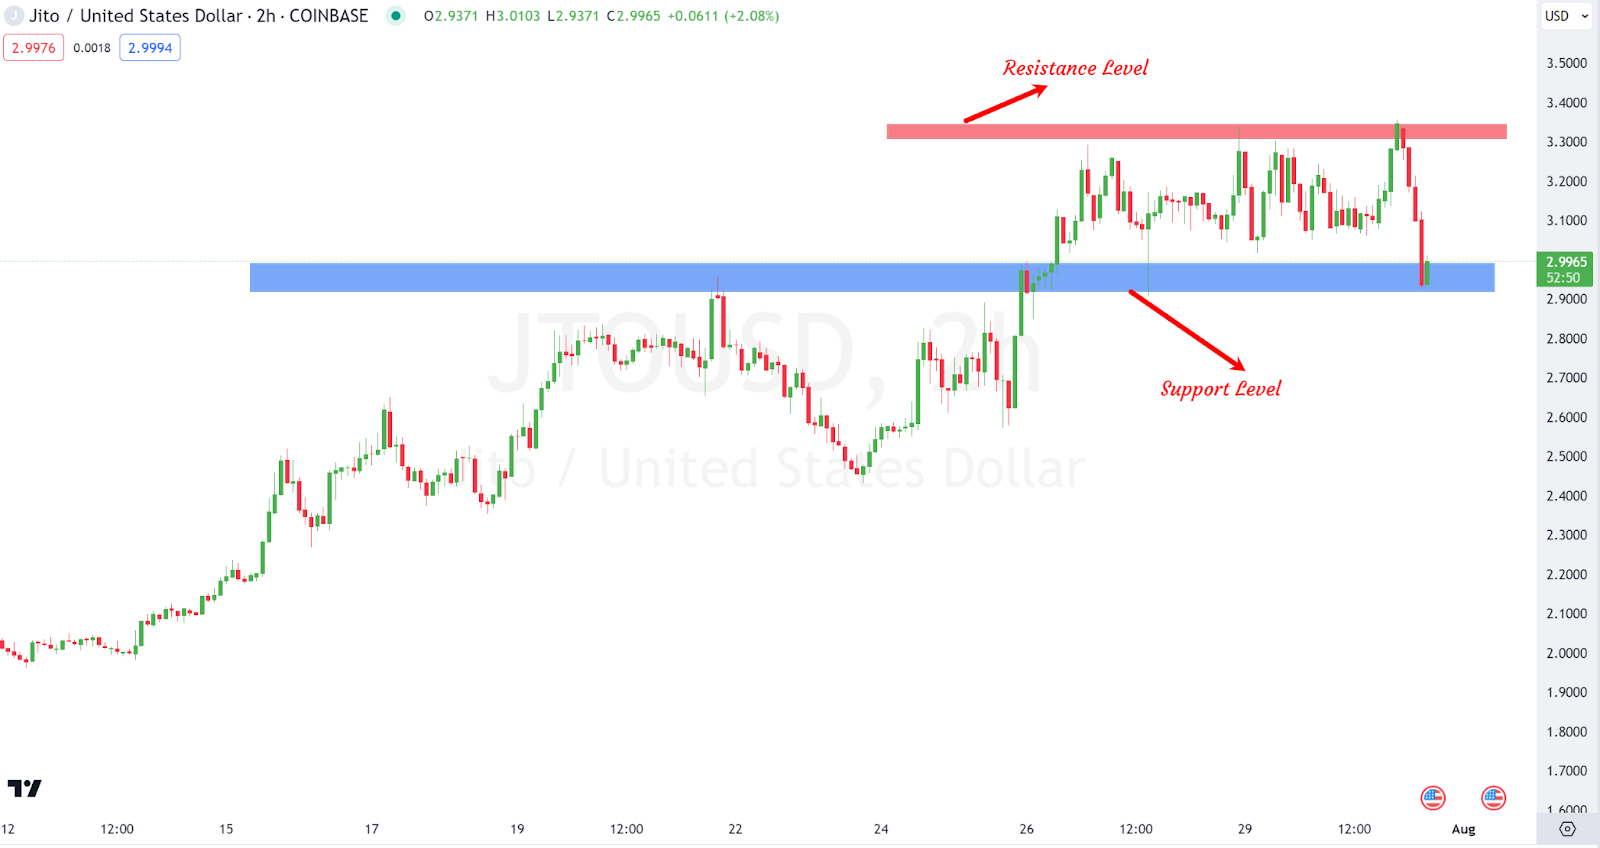
In summary, Jito (JTO) may experience a short-term bearish trend if it breaks below the $2.90 support. Conversely, holding above this level could lead to a rebound towards $3.4.
Jito (JTO) Price Prediction: Moving Averages
Looking at other charts, the token shows several exponential moving averages (EMAs) indicating the short-term and long-term trends. The EMAs used are 20, 50, 100, and 200 periods. The price of Jito (JTO) has recently dropped below the 20-period EMA (red) and the 50-period EMA (orange), indicating potential short-term bearish momentum. However, it is currently testing the 100-period EMA (cyan) around $3.00. If the price holds above this level, it might find support and bounce back.
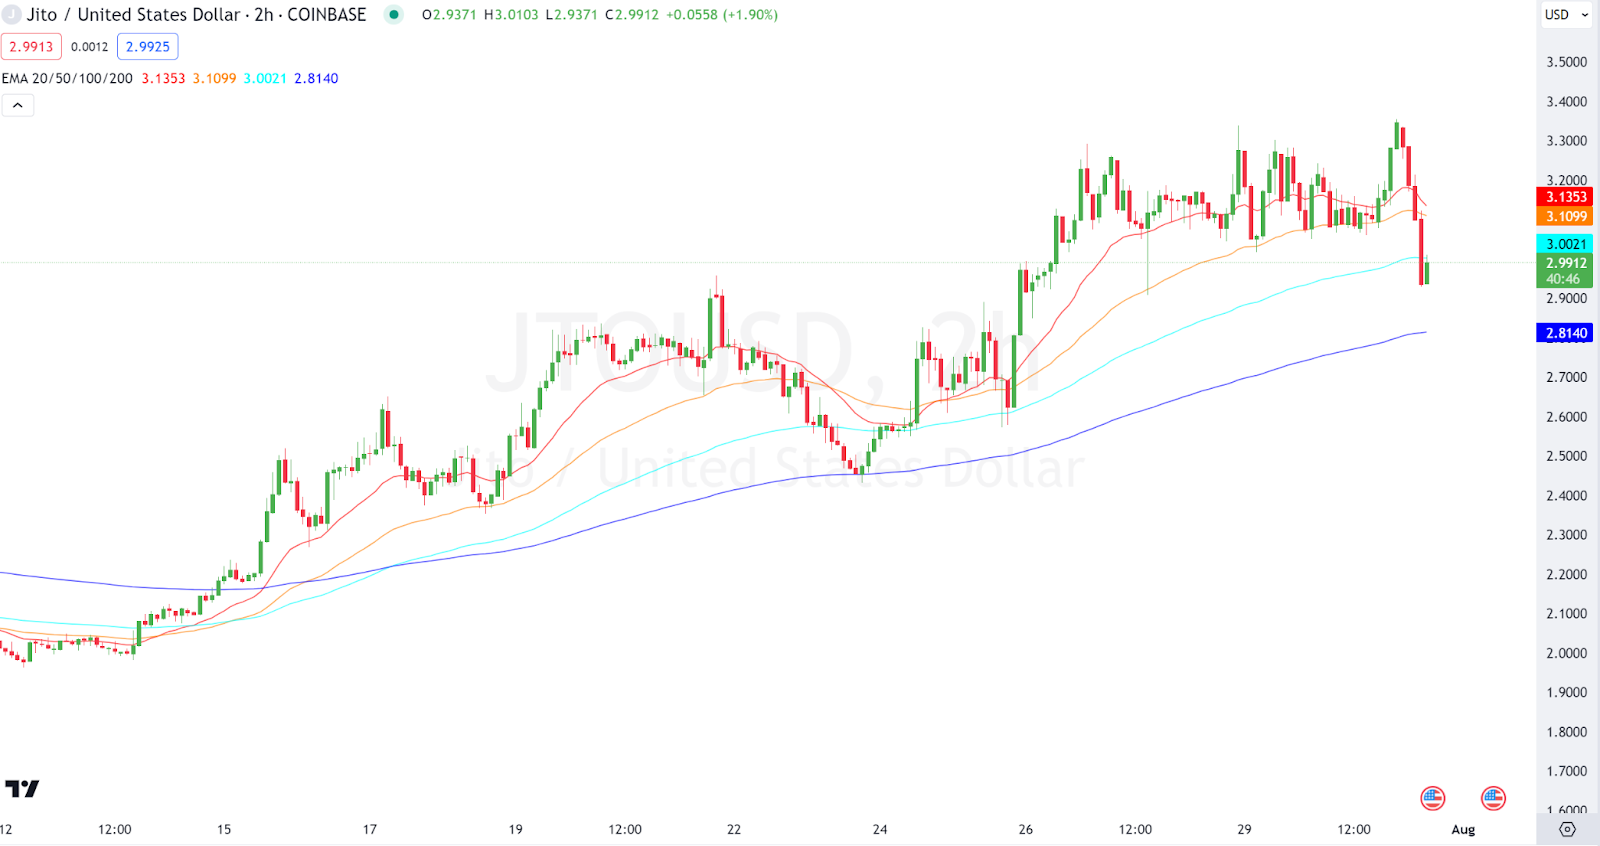
The key support level is around the 100-period EMA at $3.00. If the price breaks below this level, the next significant support is the 200-period EMA (blue) around $2.81. The resistance levels are at the 20-period EMA at $3.13 and the 50-period EMA at $3.11. The recent bearish crossover where the price dropped below the 20 and 50 EMAs suggests a potential continuation of the downtrend. However, if the price finds support at the 100-period EMA, it could attempt to retest the $3.11 to $3.13 resistance range.
Jito (JTO) Price Prediction: Where Will JTO be By December?
Looking at a long term perspective, Jito price charts show that the recent breakout from the descending channel suggests a shift in momentum from bearish to bullish. If Jito (JTO) can maintain its current trajectory, it could aim for the next resistance level around $4.00-$4.50. Immediate support is around $2.90, which aligns with the recent breakout point. As long as the price holds above this level, the bullish outlook remains intact. The primary resistance is between $4.50 and $5.00, where the price previously faced significant selling pressure.
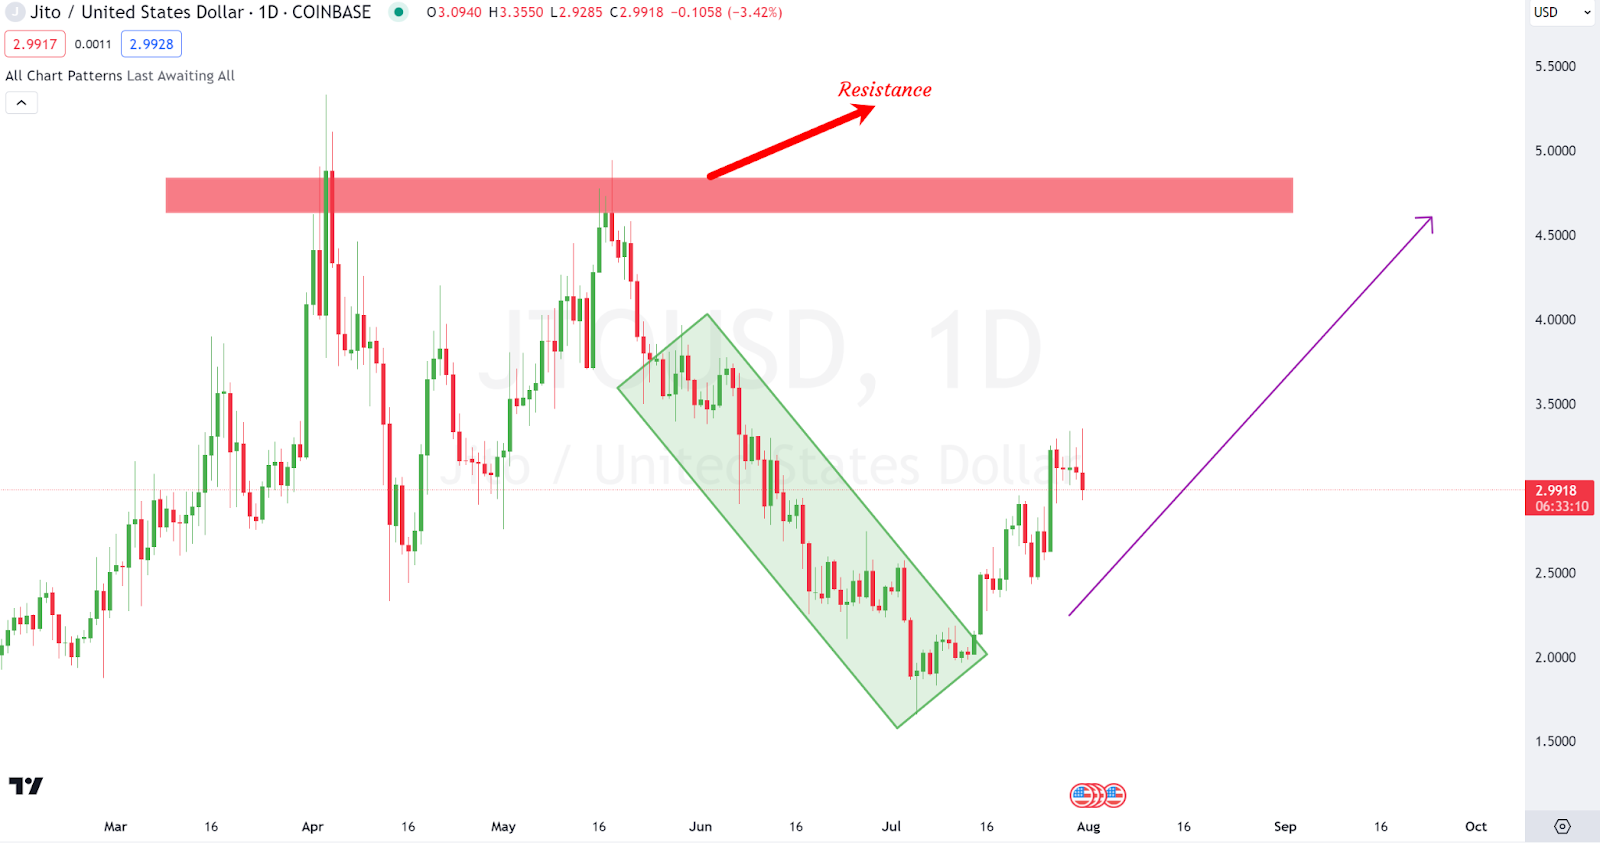
The breakout from the descending channel is a strong bullish signal. Traders should watch for confirmation with increased volume and sustained price action above the breakout level to validate the upward trend. In summary, Jito (JTO) may experience a bullish trend in the short term, targeting the $4.00-$4.50 resistance range. A break above $4.50 could set the stage for a move towards $5.00.
JITO (JTO) Price Prediction 2025
In 2025, JITO (JTO) could benefit from broader acceptance and technological advancements. Price predictions indicate a potential high of $3.12 and a low of $2.80, averaging around $2.96 for the year as the cryptocurrency market stabilizes and matures.
JITO (JTO) Price Prediction 2026
The forecast for 2026 suggests continued growth for JITO (JTO). With further integration into various sectors and enhanced utility, the price may range between $3.50 and $4.00. The average price is projected to be around $3.75, assuming positive market sentiment.
JITO (JTO) Price Prediction 2027
By 2027, JITO (JTO) might see a significant rally. The price could potentially reach a high of $5.00, with a low estimate of $4.00. Analysts predict an average price of about $4.50 as the demand for JTO increases with new developments and partnerships.
JITO (JTO) Price Prediction 2028
In 2028, JITO (JTO) is expected to maintain its upward trajectory. The price could fluctuate between $4.50 and $5.50, with an average around $5.00, driven by sustained interest and broader market trends.
JITO (JTO) Price Prediction 2029
The year 2029 might see JITO (JTO) consolidating its gains. The price range is predicted to be between $5.00 and $6.00. The average price could be around $5.50 as the market continues to recognize JTO’s value and utility.
JITO (JTO) Price Prediction 2030
By 2030, JITO (JTO) could reach new heights. Price predictions suggest a high of $6.00 and a low of $5.00, averaging around $5.50. This growth is attributed to the maturity of the cryptocurrency market and JTO’s established position within it.
FAQs
Jito (JTO) is the native token of the Jito Network, an open-source blockchain developed to streamline decentralized applications and smart contracts. It aims to provide scalable and efficient solutions attracting developers and businesses seeking advanced blockchain technology.
As of the latest data, JTO is ranked #145 on CoinMarketCap with a price of $2.98. It has a market cap of approximately $370 million and a circulating supply of 125,046,520 JTO tokens.
Recently JTO has experienced a bullish rally pushing the price to from $2.5 to $3.0 over the past month.
2024: Low of $2.60 and High of $3.30
2025: Low of $2.80 and High of $3.12
2026: Low of $3.50 and High of $4.00
2027: Low of $4.00 and High of $5.00
2028: Low of $4.50 and High of $5.50
2029: Low of $5.00 and High of $6.00
2030: Low of $5.00 and High of $6.00
Several factors can influence JTO’s price in the future including technological advancements, partnerships, broader acceptance, regulatory support and broader market dynamics.
By 2040, JTO could potentially reach $15 should market conditions as well as non-market related events favor the token’s community.
Disclaimer: The information presented in this article is for informational and educational purposes only. The article does not constitute financial advice or advice of any kind. Coin Edition is not responsible for any losses incurred as a result of the utilization of content, products, or services mentioned. Readers are advised to exercise caution before taking any action related to the company.
 Price Prediction 2026, 2027, 2028, 2029, 2030 -2050")


