 Price Prediction 2025-2030: Future Outlook and Expected Growth")
- KAITO is projected to trade between $1.68 and $2.46 in 2025, with an average price of $1.95, supported by market adoption and exchange liquidity.
- The critical resistance level at $1.7209 will determine bullish continuation, while strong support at $1.4840 could prevent deeper pullbacks during market corrections.
- If broader market sentiment remains favorable, KAITO could push beyond $2.00, testing the upper resistance range near $2.46 by year-end.
KAITO is a cryptocurrency linked to Kaito, a platform designed to simplify information discovery in the Web3 space. Launched in February 2025, Kaito helps users navigate Web3 data efficiently, improving decision-making.
Following its airdrop on February 20, 2025, KAITO saw strong market activity. Despite initial selling pressure from major crypto influencers, the token surged by nearly 50%, trading above $1.74 with a market capitalization exceeding $421 million soon after the airdrop.
As of February 24, 2025, KAITO is trading at approximately $1.68, with a 24-hour trading volume of $622.92 million. The circulating supply stands at 240 million KAITO tokens, contributing to a market cap of around $403.21 million.
KAITO has gained attention for its “tweet-to-earn” mechanism, known as YAP, which rewards users for engaging in crypto discussions on social media. This feature has significantly boosted the platform’s visibility and user participation in the crypto community.
The token is listed on major exchanges, including Binance, OKX, Bitget, and OrangeX, with KAITO/USDT being the most actively traded pair.
Table of contents
- KAITO (KAITO) Current Market Status
- KAITO (KAITO) Price Prediction 2025-2030 Overview
- Bollinger Band Analysis for KAITO (KAITO)
- MACD Analysis for KAITO (KAITO)
- Relative Strength Index (RSI) Analysis for KAITO (KAITO)
- Support and Resistance levels for KAITO (KAITO)
- KAITO (KAITO) 2025 Price Prediction Analysis
- KAITO (KAITO) Price Prediction for 2026
- KAITO (KAITO) Price Prediction for 2027
- KAITO (KAITO) Price Prediction for 2028
- KAITO (KAITO) Price Prediction for 2029
- KAITO (KAITO) Price Prediction for 2030
- FAQs
KAITO (KAITO) Current Market Status
| Name | KAITO |
| Symbol | KAITO |
| Rank | #133 |
| Price | $1.82 |
| Price Change (24h) | 20.72% (1d) |
| Price Change (7d) | 56.31% (7d) |
| Market Cap | $440.32M |
| Circulating Supply | 241.38M KAITO |
| Total Supply | 1B KAITO |
KAITO (KAITO) Price Prediction 2025-2030 Overview
| Year | Low Price ($) | Average Price ($) | High Price ($) |
| 2025 | 1.68 | 1.95 | 2.46 |
| 2026 | 1.92 | 2.62 | 3.45 |
| 2027 | 2.83 | 3.85 | 4.68 |
| 2028 | 3.75 | 5.03 | 5.94 |
| 2029 | 5.05 | 6.65 | 8.02 |
| 2030 | 6.55 | 8.02 | 10.16 |
Bollinger Band Analysis for KAITO (KAITO)
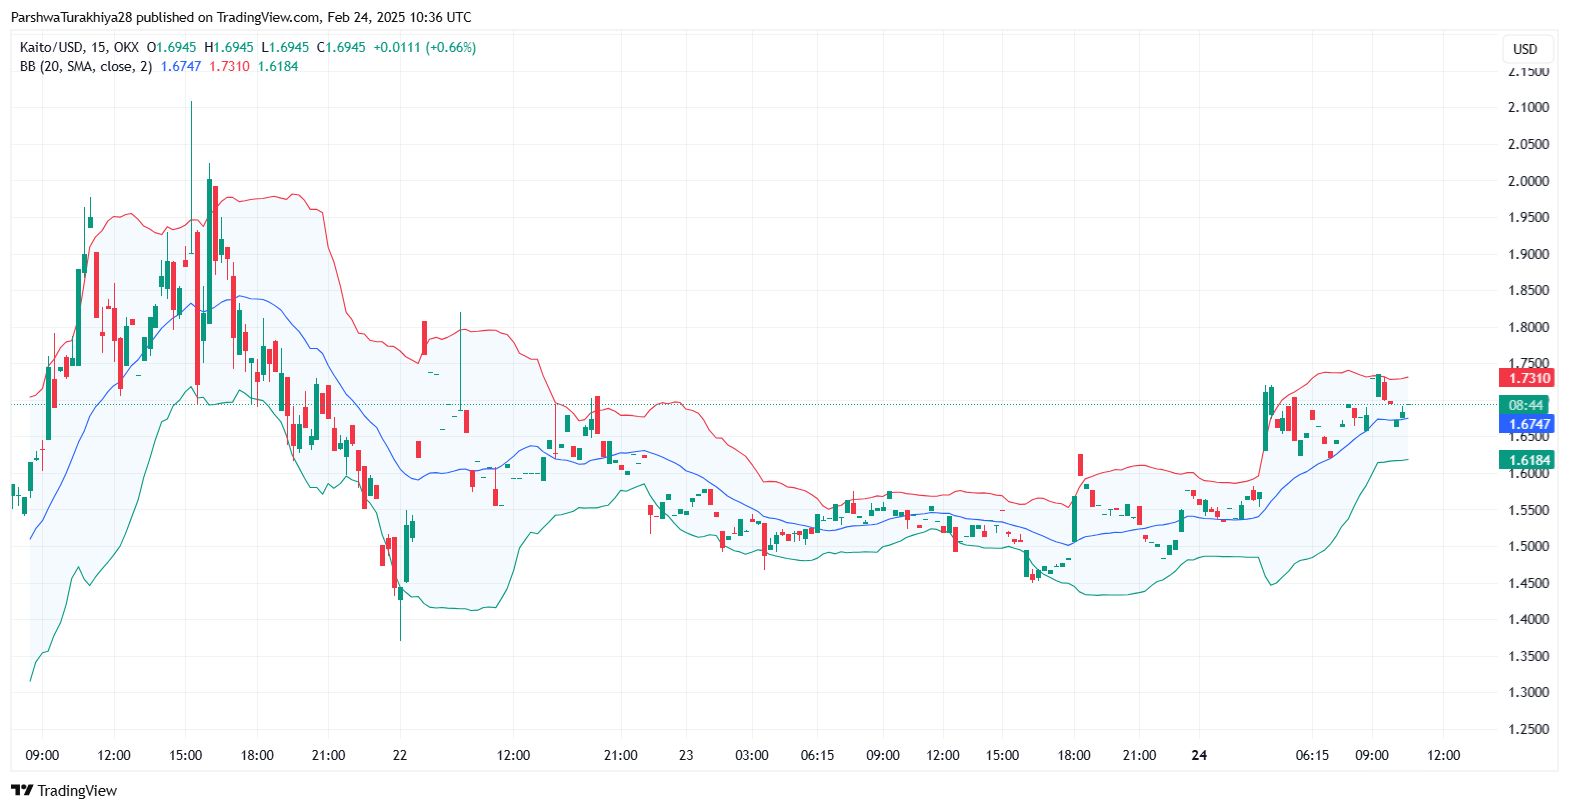
The Bollinger Bands for KAITO indicate increasing volatility, with the price recently testing the upper band near $1.7279, while the lower band is positioned at $1.6162. The midline, which represents the 20-period SMA, is around $1.6720, acting as dynamic support. The price has recently pushed towards the upper band, indicating bullish pressure.
However, if the price fails to maintain momentum above $1.7279, we could see a pullback towards the midline, which has previously acted as a re-entry zone for buyers. A further decline below this level could lead to a correction towards $1.6162, aligning with historical support. On the upside, a breakout above $1.7279 could drive the price toward the $1.75 – $1.78 range, reflecting heightened buying activity.
MACD Analysis for KAITO (KAITO)
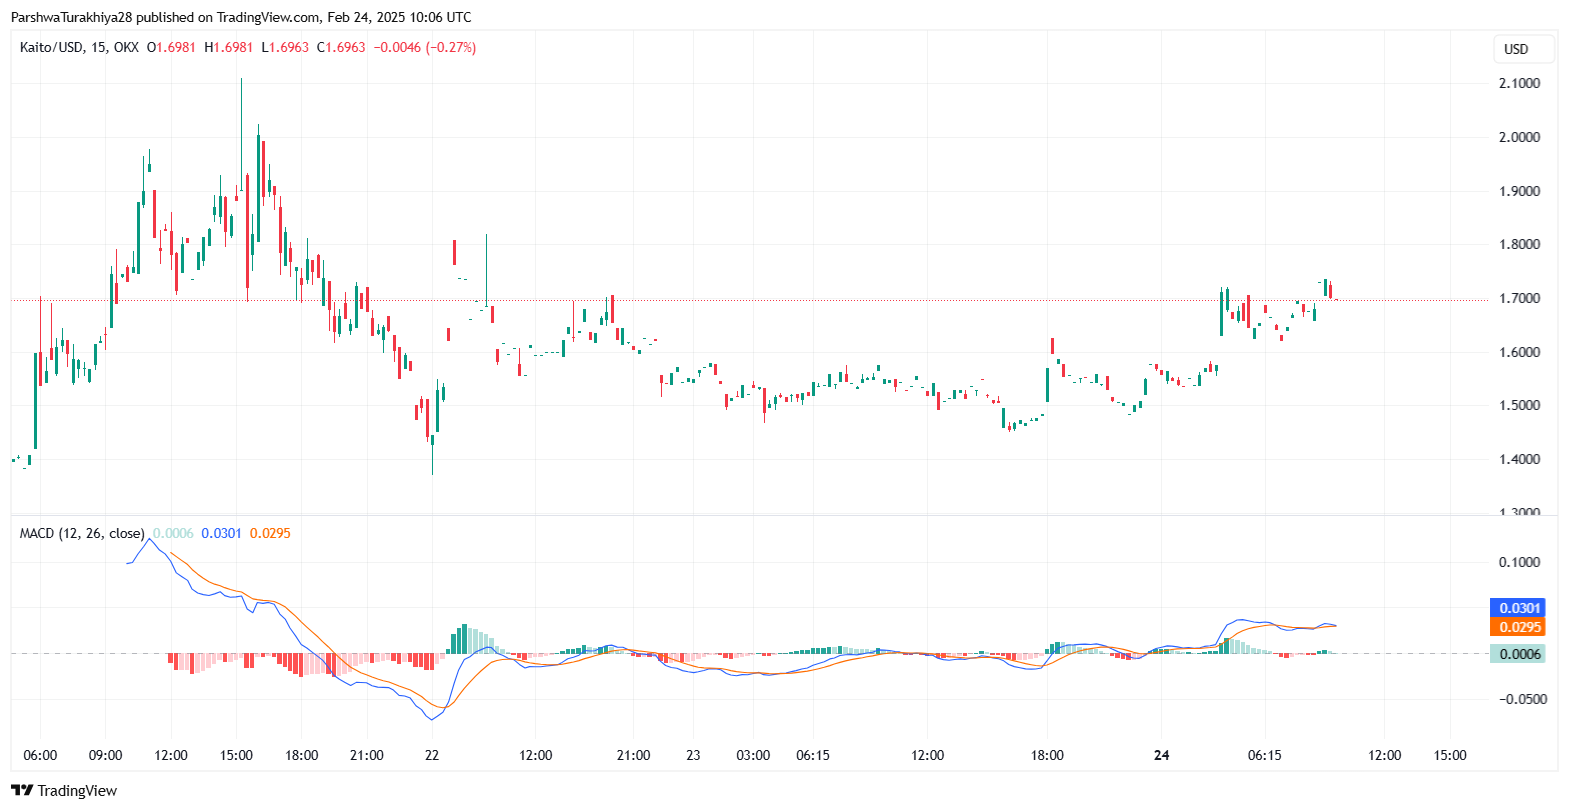
The MACD indicator shows a bullish crossover, with the MACD line at 0.0301 moving above the signal line at 0.0295, suggesting upward momentum. However, the histogram has started showing signs of flattening, indicating a potential slowdown in bullish strength. If the MACD histogram continues to shrink, it would suggest declining momentum, increasing the likelihood of a price consolidation.
For sustained bullish movement, the MACD must remain above the signal line, ideally supported by increasing volume. If a bearish crossover occurs, where the MACD line crosses below the signal line, a downside correction toward $1.60 – $1.62 could be expected. However, if buying pressure increases, KAITO could aim for $1.75 – $1.80 in the near term.
Relative Strength Index (RSI) Analysis for KAITO (KAITO)
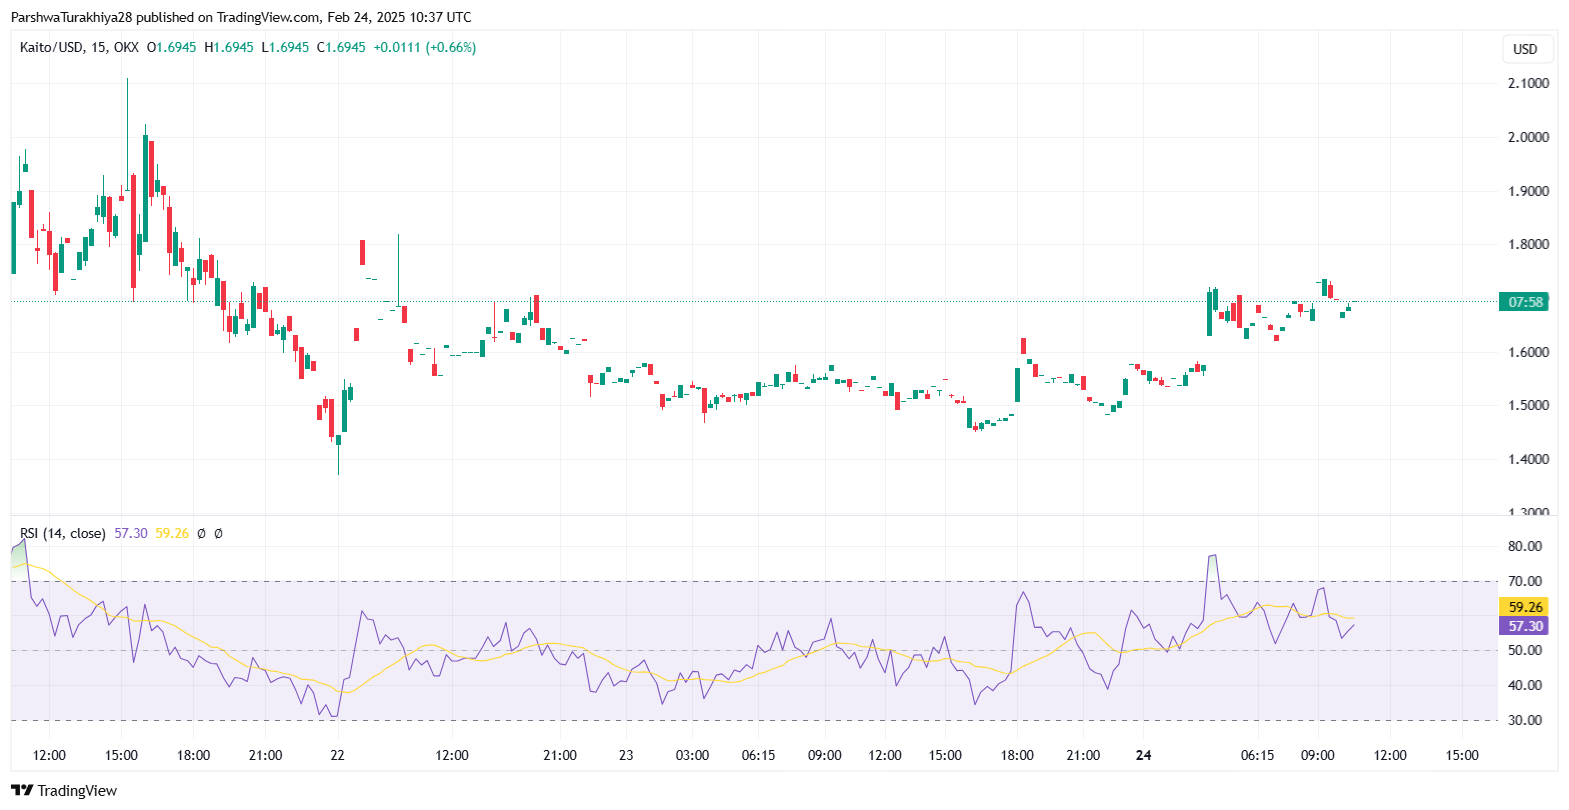
The RSI indicator is currently at 60.36, which suggests mild bullish momentum but not yet in the overbought zone. The RSI previously spiked above 70, signaling an overbought condition, leading to a price correction. It has since rebounded from the 50-level, which is often considered a neutral zone.
If RSI maintains its position above 60, it would indicate continued strength, potentially supporting further gains toward $1.75 – $1.80. However, if RSI declines below 50, it could signal weakening momentum, increasing the probability of a pullback toward $1.62 – $1.65. If RSI falls below 40, a deeper retracement toward $1.55 – $1.58 could follow as sellers regain control.
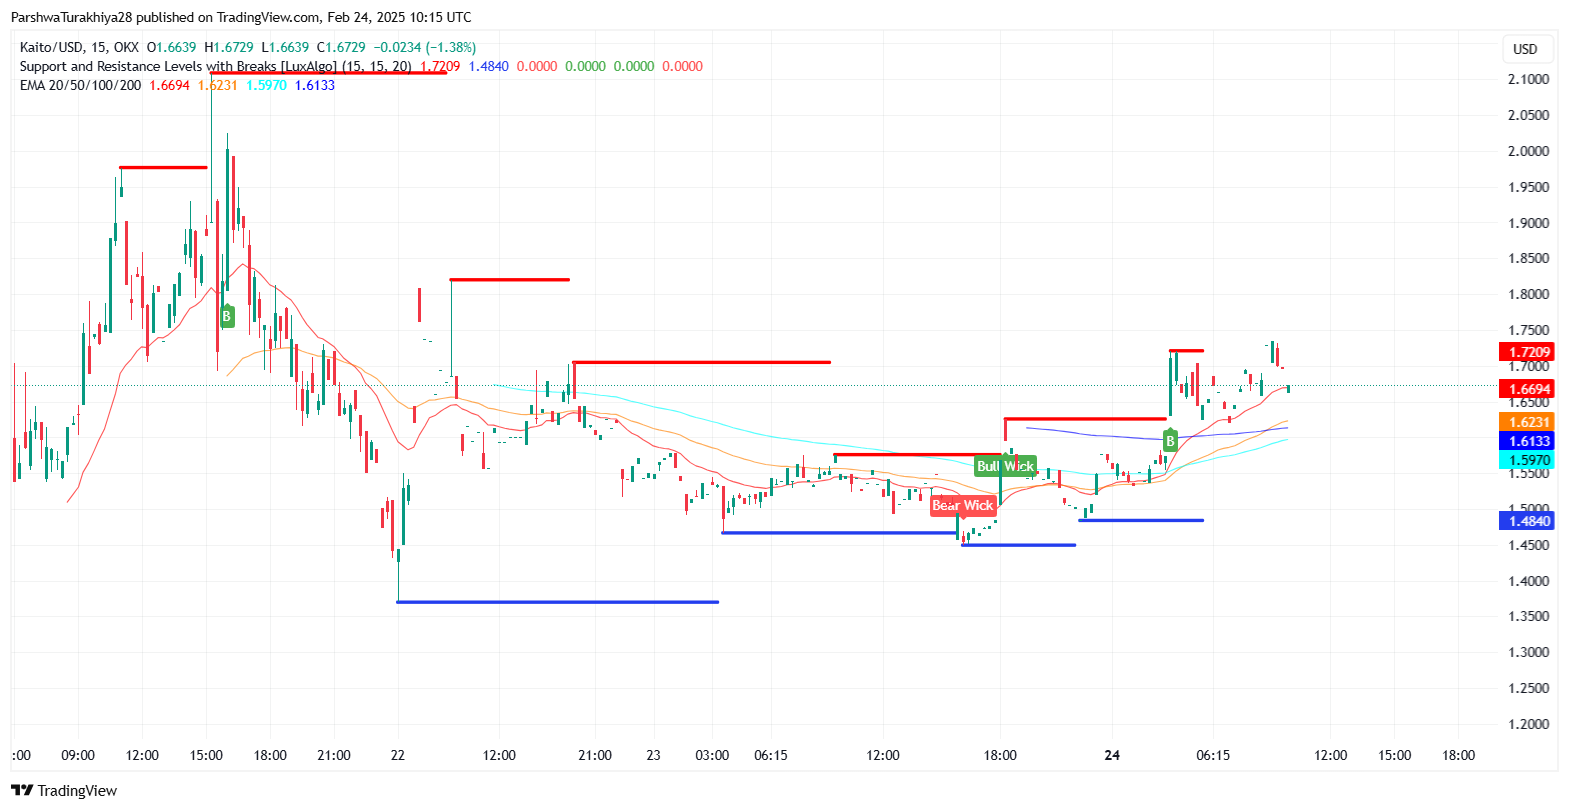
Support and Resistance levels for KAITO (KAITO)
KAITO’s price action highlights key resistance at $1.7209, where previous price rejections occurred. If the price successfully breaks above this level with strong volume, the next target could be around $1.75 – $1.78, aligning with previous liquidity zones. However, failure to break $1.7209 could trigger a pullback towards immediate support at $1.6720, which coincides with the Bollinger Bands’ midline.
Below this, additional support is found at $1.6162, which has previously acted as a strong demand zone. A break below $1.6162 could expose $1.55, a major support level that must hold to prevent further downside. On the bullish side, a decisive breakout above $1.75 could trigger a rally towards $1.80 – $1.85, marking new highs in the short term.
KAITO (KAITO) 2025 Price Prediction Analysis
KAITO (KAITO) is expected to trade within a projected range of $1.68 to $2.46 in 2025, with an average price stabilizing around $1.95. The price action suggests that key support and resistance levels will play a crucial role in defining price movements throughout the year.
The primary support level appears near $1.4840, where previous price action has shown strong buying interest. If the market faces downward pressure due to broader sell-offs or increased liquidations, this level could act as a major buffer. A further decline could push KAITO toward the $1.5970 support zone, aligning with a historically significant level where buyers previously stepped in. However, in a prolonged bearish scenario, the price could test $1.48, marking the absolute low for 2025.
On the upside, the immediate resistance level is positioned at $1.7209, a level where previous price rejections have occurred. A breakout above this level with strong trading volume could indicate renewed bullish momentum, pushing the price toward the next major resistance at $1.80. If the broader market sentiment remains positive and KAITO gains further adoption, the price could target the yearly high of $2.46, marking its potential peak for 2025.
Overall, KAITO’s price movements within these ranges will largely depend on market conditions, investor sentiment, and liquidity flow.
KAITO (KAITO) Price Prediction for 2026
KAITO is projected to trade within a range of $1.92 to $3.45 in 2026, with an expected average price of $2.62. As adoption grows and the market stabilizes, KAITO could see stronger accumulation near $1.92, acting as a solid support zone. If buying momentum increases, a breakout above $3.45 could trigger further upside potential. However, macroeconomic uncertainties and broader crypto market fluctuations may introduce volatility.
KAITO (KAITO) Price Prediction for 2027
KAITO is expected to trade between $2.83 and $4.68, with an average price of $3.85 in 2027. As the token gains further traction, it could establish $2.83 as a key support level, preventing deeper pullbacks. A sustained uptrend could push the price toward $4.68, where resistance may emerge as traders take profits. If institutional investors begin showing interest, the price could stabilize closer to the higher range.
KAITO (KAITO) Price Prediction for 2028
With growing utility and increasing adoption, KAITO could see a price range of $3.75 to $5.94, averaging $5.03 in 2028. The token’s resilience will likely be tested at $3.75, but if bullish sentiment prevails, a rally beyond $5.94 could occur. However, regulatory shifts and overall market sentiment will be crucial in determining whether KAITO can maintain its upward trajectory.
KAITO (KAITO) Price Prediction for 2029
By 2029, KAITO is expected to trade between $5.05 and $8.02, with an average valuation of $6.65. Increased mainstream adoption and potential strategic partnerships could push the price higher. A breakout past $8.02 could signal a strong long-term investment narrative, though profit-taking could cause temporary corrections. Market sentiment and external economic conditions will play a key role in shaping its movement.
KAITO (KAITO) Price Prediction for 2030
KAITO is forecasted to trade within $6.55 to $10.16, with an average price of $8.02 in 2030. If the project continues its expansion, it could solidify its position in the crypto space, attracting larger investors. The $10.16 resistance level will be a critical point, and a breakout could lead to a new price discovery phase. However, global financial market conditions and investor confidence will determine whether KAITO can sustain long-term growth.
FAQs
KAITO is projected to trade between $1.68 and $2.46, with an average price of around $1.95.
The main support levels are $1.4840 and $1.5970, while resistance levels are at $1.7209 and $2.00.
While the projected high for 2025 is $2.46, strong market conditions and demand could push it slightly higher.
Exchange listings, investor sentiment, adoption of Kaito’s platform, and overall crypto market trends will play a role.
The price trend suggests a bullish outlook, but market fluctuations and corrections may cause temporary pullbacks.
By 2030, KAITO is expected to trade between $6.55 and $10.16, depending on adoption and market expansion.
If market conditions worsen, a drop toward $1.4840 is possible, but strong buying interest at this level could provide stability.
The Bollinger Bands indicate moderate volatility, with potential price fluctuations within its projected range.
Buying near strong support levels around $1.60 – $1.65 may provide a better risk-reward opportunity.
KAITO’s integration with Web3 and its “tweet-to-earn” model make it a unique project, attracting attention in the crypto space.
Disclaimer: The information presented in this article is for informational and educational purposes only. The article does not constitute financial advice or advice of any kind. Coin Edition is not responsible for any losses incurred as a result of the utilization of content, products, or services mentioned. Readers are advised to exercise caution before taking any action related to the company.


