


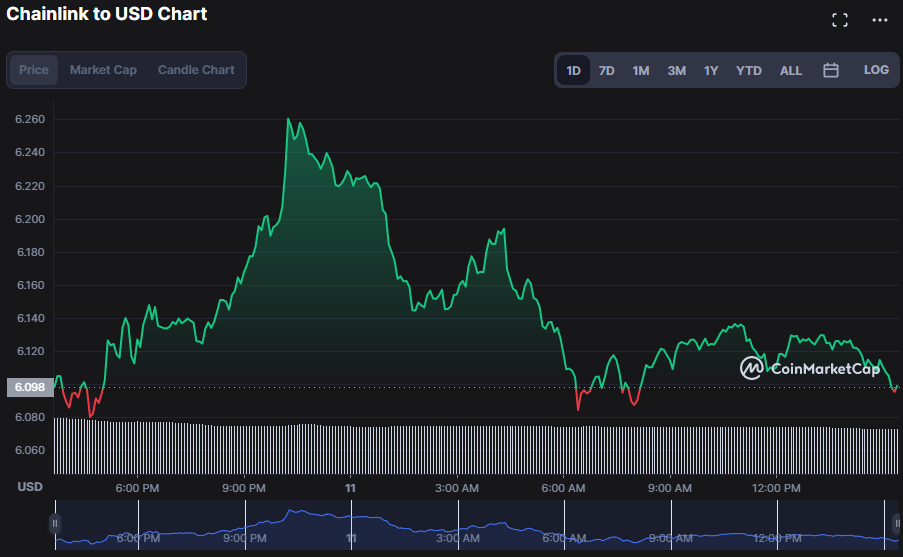
- The market for Chainlink is dominated by bulls, who have pushed the price up by 0.22%, to $6.10.
- LINK has fluctuated between $6.08 and $6.27 during the last 24 hours.
- In order to disprove the LINK market’s uncertainty, bulls need to apply pressure.
The price of Chainlink (LINK) has been supported around $6.08 for the last 24 hours, preventing a further decline. At press time LINK jumped to $6.10 with an increase of 0.22%, as bullish momentum returned.
During the upswing, market capitalization increased to $3,100,290,377, while 24-hour trading volume dropped to $197,577,423. This shift shows that investors are becoming pessimistic about LINK’s market prospects.
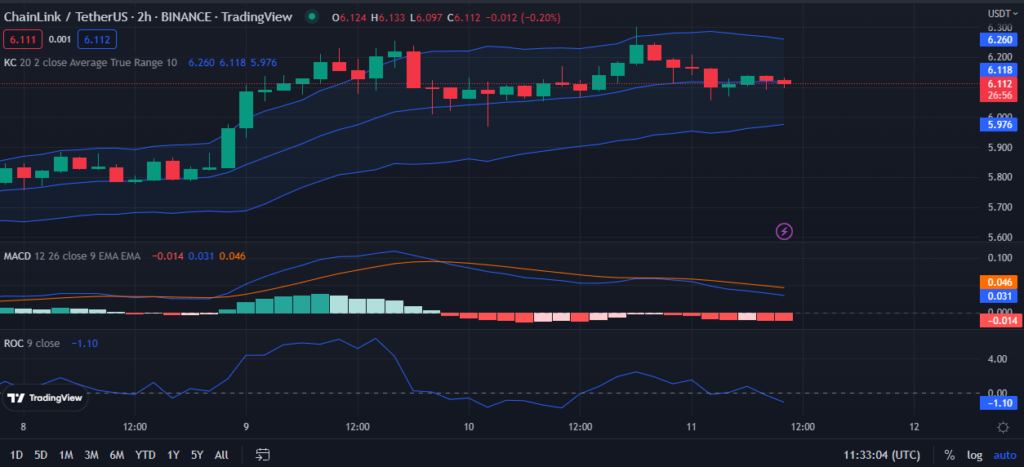
As the Keltner Channel bands narrow, with values of 6.257 at the top and 5.980 at the bottom, the LINK market price is expected to go toward the middle band’s 6.118 level. This is a “squeeze,” and it frequently foretells a reversal or shift in market direction. Market watchers would do well to keep an eye on this in anticipation of future trade opportunities. A squeeze may also indicate a trend reversal, which can present traders with a favorable entry position to profit from a probable trend reversal.
The moving average convergence/divergence (MACD) blue line recently falling below the MACD signal line on the LINK market has signaled possible near-term price declines. LINK’s momentum is fading and its price may soon move down is negative divergence in the MACD’s histogram. Traders should be ready to either take profit or place stop-loss orders to safeguard their positions if the market confirms a negative view.
The Rate of Change (ROC) just dropped to -1.31, indicating the LINK price will inevitably fall. The negative ROC value indicates LINK’s price is dropping faster than it’s rising, indicating a downtrend trend for LINK; therefore, traders and investors should proceed with caution.
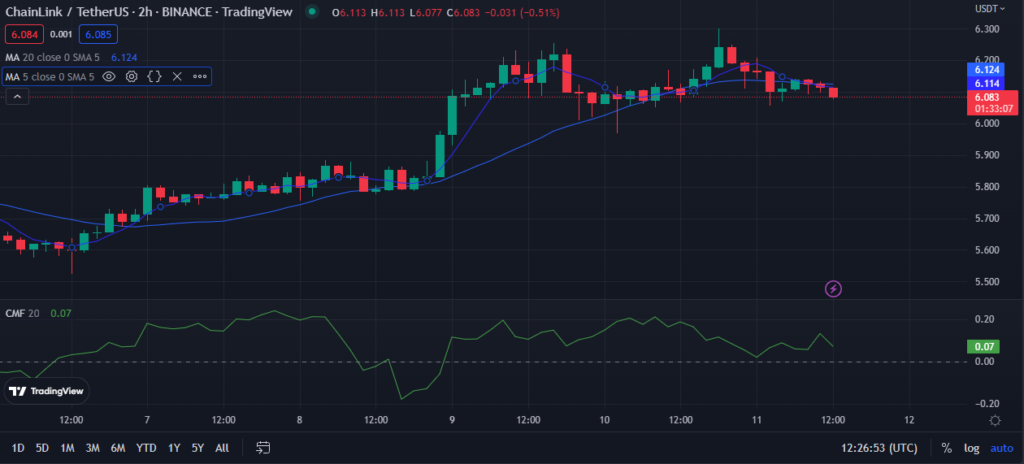
A bearish crossover is seen in the LINK market as the 5-day MA crosses 6.117 and the 20-day MA touches 6.125. This movement indicates that the short-term trend for LINK is turning negative, which could indicate a period of lower prices or a larger market decline. Investors contemplating this market at this time should exercise caution.
Furthermore, the market’s bearish trend is confirmed by LINK’s Chaikin Money Flow (CMF) rating of 0.07. This shows that LINK demand is decreasing and that bears have taken control of the market. As a consequence, before entering long positions, short-term traders may need to consider going short or waiting for a break in the bearish trend.
Although the market’s technical indications suggest to a long-term slump, the trend might reverse if bulls exert adequate pressure.
Disclaimer: The views and opinions, as well as all the information shared in this price analysis, are published in good faith. Readers must do their own research and due diligence. Any action taken by the reader is strictly at their own risk. Coin Edition and its affiliates will not be held liable for any direct or indirect damage or loss.
Disclaimer: The information presented in this article is for informational and educational purposes only. The article does not constitute financial advice or advice of any kind. Coin Edition is not responsible for any losses incurred as a result of the utilization of content, products, or services mentioned. Readers are advised to exercise caution before taking any action related to the company.


