


- LINK’s bullish momentum encounters resistance, but negativity diminishes.
- Potential buying opportunity arises in LINK as negative sentiment fades.
- Gradual market recovery is anticipated for LINK despite resistance levels.
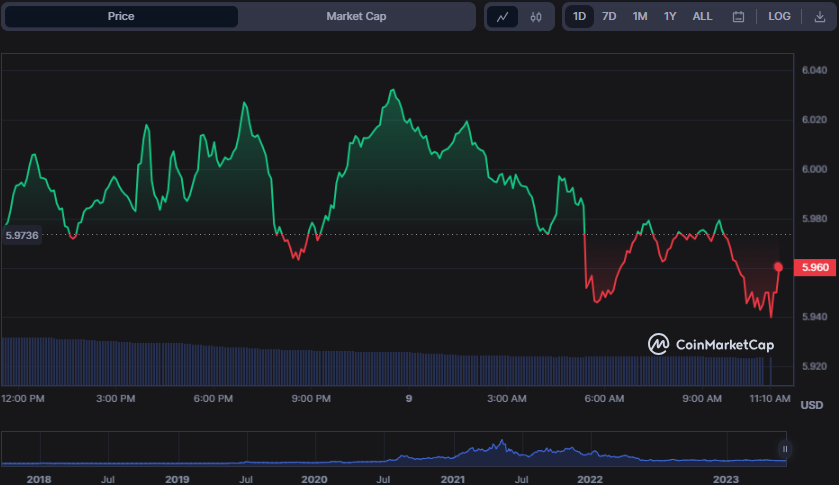
Chainlink (LINK) market has been dominated by bullish momentum in the previous 24 hours, with prices leaping to a 24-hour high of $6.03 before encountering resistance. However, failing to break through this barrier resulted in LINK’s price falling to $5.95 as of press time, a 0.42% drop from its previous close.
Due to the dip, LINK’s market capitalization and 24-hour trading volume fell by 0.52% and 41.30%, respectively, to $3,073,022,662 and $93,602,292.
If bears break through the $5.94 support level, LINK’s next probable support level might be $5.50. The $6.20 level is the next probable point of resistance if the bulls push the price higher.
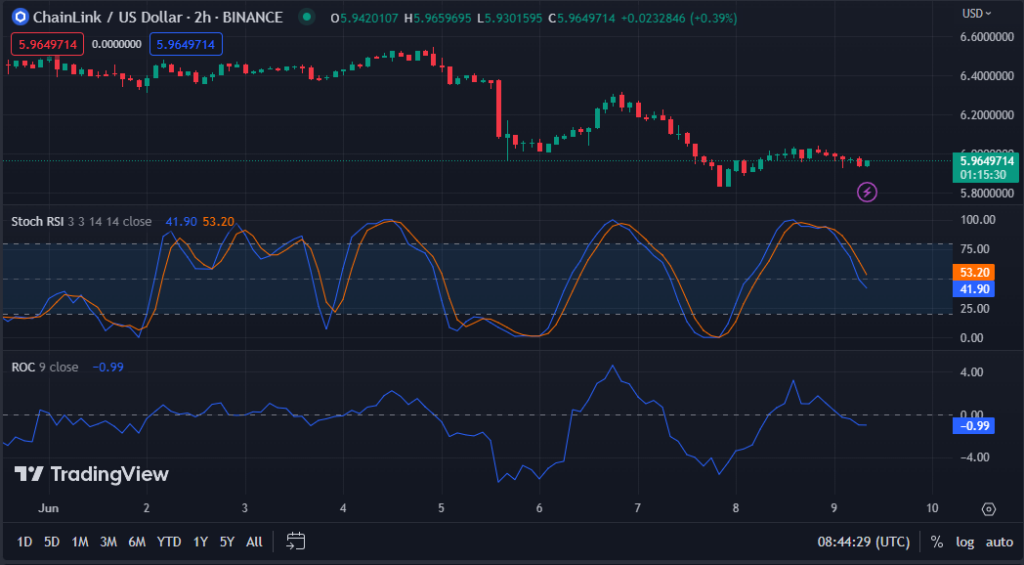
On the LINK/USD 2-hour price chart, the stochastic RSI value of 42.46 and pointing downward shows that the negative trend may continue in the near term. If the stochastic RSI falls below 20, it may suggest oversold circumstances and a possible buying opportunity.
This rate of change (ROC) movement southwards and into the negative area, with a rating of -1.05, adds to the pessimistic attitude. However, if purchasing pressure increases and the rate of change (ROC) returns to positive territory, it may indicate a shift in market sentiment toward bullishness.
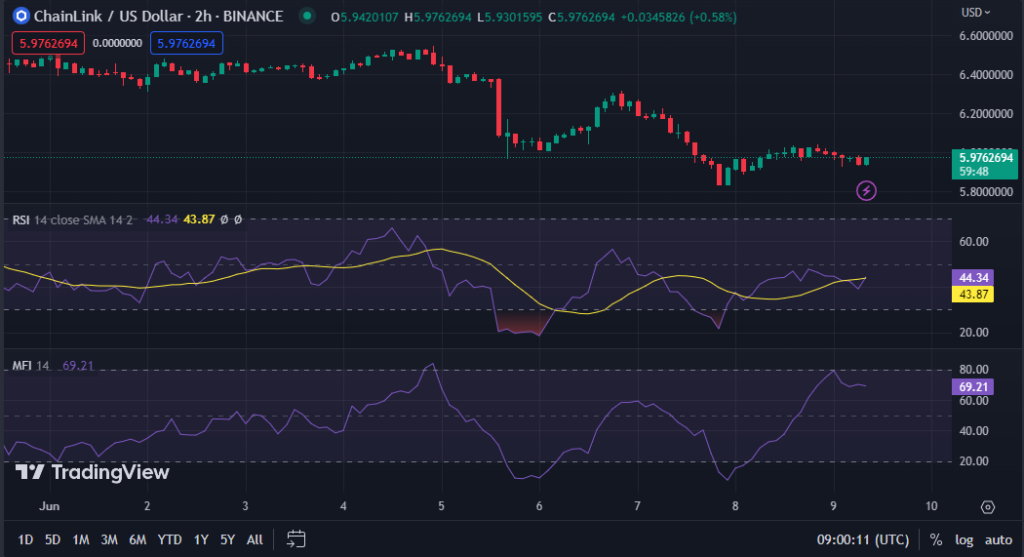
The Relative Strength Index (RSI) is 43.23 and is trending higher as it attempts to exceed the signal line on the LINK price chart, indicating that the negative momentum is diminishing.
This movement may cause a change in market sentiment as purchasers gain confidence in the LINK’s prospects.
The negative impact on LINK is diminishing, with a Money Flow Index rating of 69.21. This is a good indication for investors hoping for a market comeback. However, given its southern movement, this reversal may be slow since LINK still has to break past several critical resistance levels.
In conclusion, LINK’s price faces resistance but shows signs of diminishing negativity, presenting a potential buying opportunity in the near term.
Disclaimer: The views, opinions, and information shared in this price prediction are published in good faith. Readers must do their research and due diligence. Any action taken by the reader is strictly at their own risk. Coin Edition and its affiliates will not be liable for direct or indirect damage or loss.
Disclaimer: The information presented in this article is for informational and educational purposes only. The article does not constitute financial advice or advice of any kind. Coin Edition is not responsible for any losses incurred as a result of the utilization of content, products, or services mentioned. Readers are advised to exercise caution before taking any action related to the company.


