- Chainlink price analysis shows a strong bullish momentum.
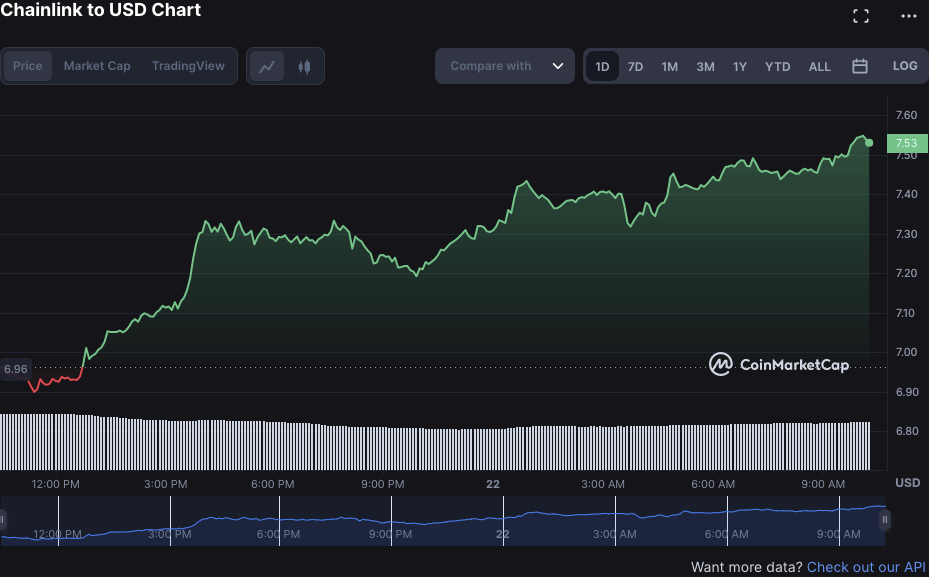
- LINK/USD is currently at $7.53, a 5.97% increase over the past 24 hours.
- If bulls persist, the LINK token could target the $7.60 level soon.
The Chainlink price analysis shows a bullish trend, as an increase has been recorded in the last 24 hours. The market has been following bullish for the past few days, and the price has significantly increased. The LINK/USD pair has surged to $ 7.53 in the last 24 hours as more investors are showing interest in the token.

The bulls are demonstrating the strength and are pushing the token higher. The resistance level at $7.55 has been broken to the upside, and a further increase is expected in the near future. If bulls manage to break the next resistance at $7.60, then we can expect a further increase in the LINK token price. The support level is still strong at $6.90, and if the price retraces downward, then this support can be expected to hold.
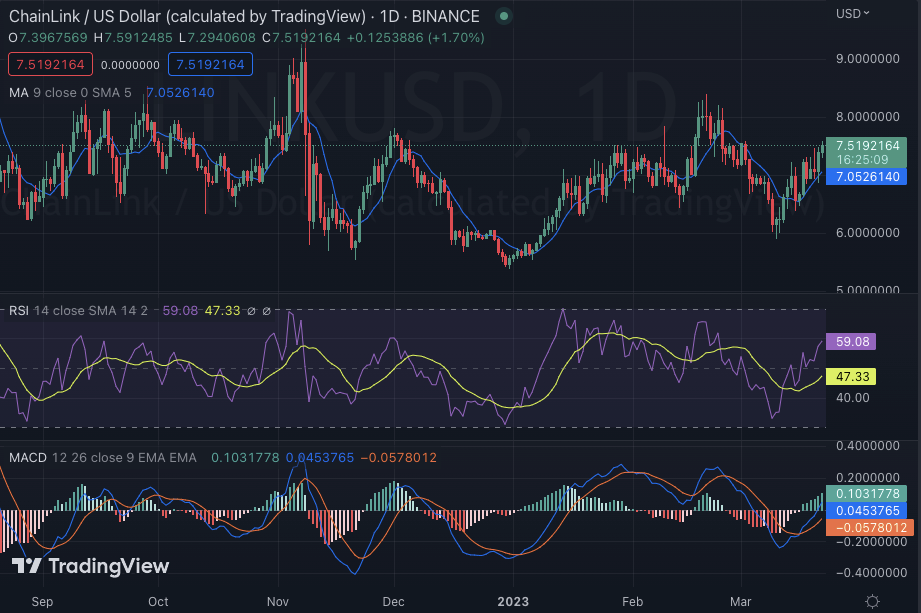
The daily chart for the LINK/USD pair shows a strong bullish momentum as the price is currently trading above the $7.50 level, with a 5.97 percent increase in the past 24 hours. The 24-hour trading volume is still in a decrease as the buyers are taking a cautious approach. The market capitalization is currently at $3.89 billion, and with an increase of 8.39 percent in the past 24 hours, it is expected to increase further if the bulls continue to dominate the market.

The technical indicators are also showing a bullish trend, as the moving average indicator is in a bullish crossover. The MA is currently at $7.05 on the daily chart and is showing an upward trend. The relative strength index (RSI) is also at a high of 59.08, indicating that the buyers are in control of the market. Furthermore, if we measure the buying pressure by looking at the MACD oscillator graph, we can see that it is significantly increasing as well.
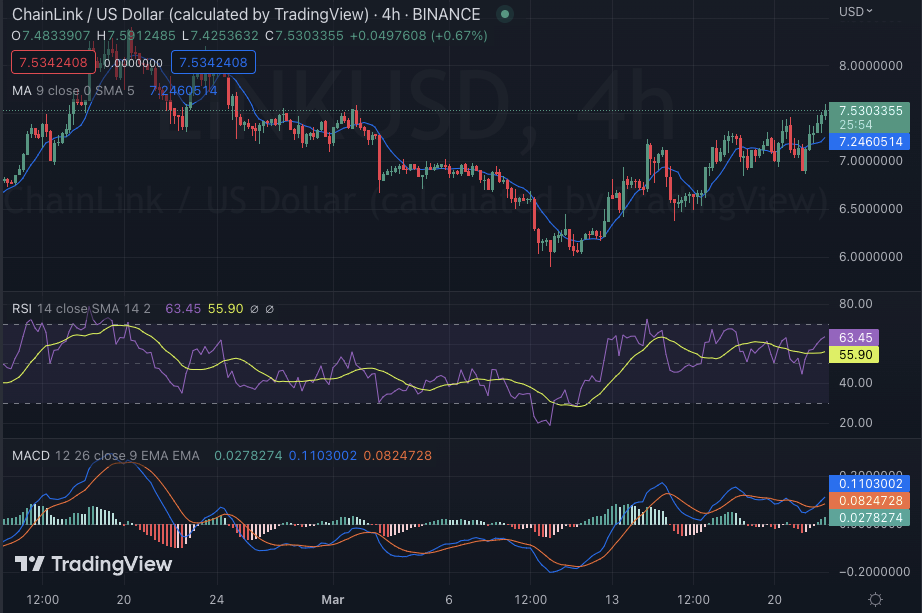
The 4-hour chart for Chainlink price analysis shows a price has undergone a recovery today after yesterday’s bearish pressure. The token has been trading in the range bound of $6.90 to $7.55 in the past 24 hours representing the support and the resistance level, respectively, and is currently trading in the upper range, which indicates that the buyers are dominant.

The hourly technical indicators also show bullish trends as the RSI has crossed above the 60 levels moving towards the overbought territory, indicating that the buying pressure is increasing. The Moving average converges divergence (MACD) remains in the bullish region, with green lines crossing over each other on the histogram. The 4-hour moving average indicator is currently at $7.24, just below the current price, which is a bullish sign for the token.
In conclusion, LINK/USD analysis shows that the bulls are in control of the market, and the price is expected to target the $7.60 level soon if the buyers continue to dominate. The technical indicators are also showing positive trends that support this prediction. The support level and resistance level must be monitored carefully, as they could change the trend in either direction at any time.
Disclaimer: The views and opinions, as well as all the information shared in this price analysis, are published in good faith. Readers must do their own research and due diligence. Any action taken by the reader is strictly at their own risk, Coin Edition and its affiliates will not be held liable for any direct or indirect damage or loss.
Disclaimer: The information presented in this article is for informational and educational purposes only. The article does not constitute financial advice or advice of any kind. Coin Edition is not responsible for any losses incurred as a result of the utilization of content, products, or services mentioned. Readers are advised to exercise caution before taking any action related to the company.


