


 Downtrend Sparks Concerns: High Risk, Low Reward?")
- Litecoin’s recent negative sentiment raises worries among crypto enthusiasts.
- Positive indicators emerge, but concerns persist over Litecoin’s long-term prospects.
- Analyst Benjamin Cowen advises caution, citing Litecoin’s poor performance against BTC.
Despite Litecoin (LTC) halving on August 2, negative sentiment has prevailed, prompting alarm among crypto enthusiasts in recent weeks. In addition, bears have dominated in the last 24 hours, sending LTC prices down from a high of $65.74 to a low of $63.84 before leveling out.
Litecoin (LTC) was trading at $64.77 at press time, down 0.89% from its intra-day high. Consequently, Litecoin’s market cap dropped to $4,765,362,120, while its 24-hour trading volume fell to $252,653,192, a drop of 1.57% and 99.43%, respectively, demonstrating the dwindling confidence from investors.
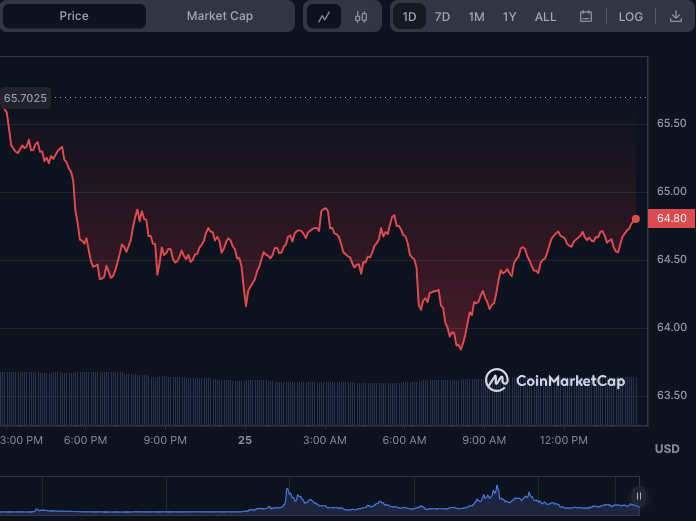
LTC/USD 24-hour price chart (source: CoinMarketCap)
Crypto analyst Benjamin Cowen has recently sounded the alarm about Litecoin. According to Cowen, the coin’s performance against Bitcoin (BTC) has been dismal. Specifically, Litecoin has depreciated by 95% against BTC since 2013.
Cowen suggests that Litecoin is a high-risk investment with very low reward, especially given the economic backdrop of the Federal Reserve’s money-printing spree. Consequently, Cowen advises investors to stay away, as his Monte Carlo simulations show a 0.0% allocation to Litecoin yields the best risk-adjusted returns.
LTC/USD Technical Analysis
However, some glimmers of hope emerge when examining the LTCUSD technical indicators. The Relative Strength Index (RSI) on Litecoin’s 2-hour price chart is rising and currently sits at 49.12. Although this level is below 50, indicating selling pressure, it suggests that bearish momentum may wane.
Additionally, the Moving Average Convergence Divergence (MACD) has moved above its signal line with a reading of -0.209937. The histogram also shows smaller green bars, indicating decreased selling pressure.
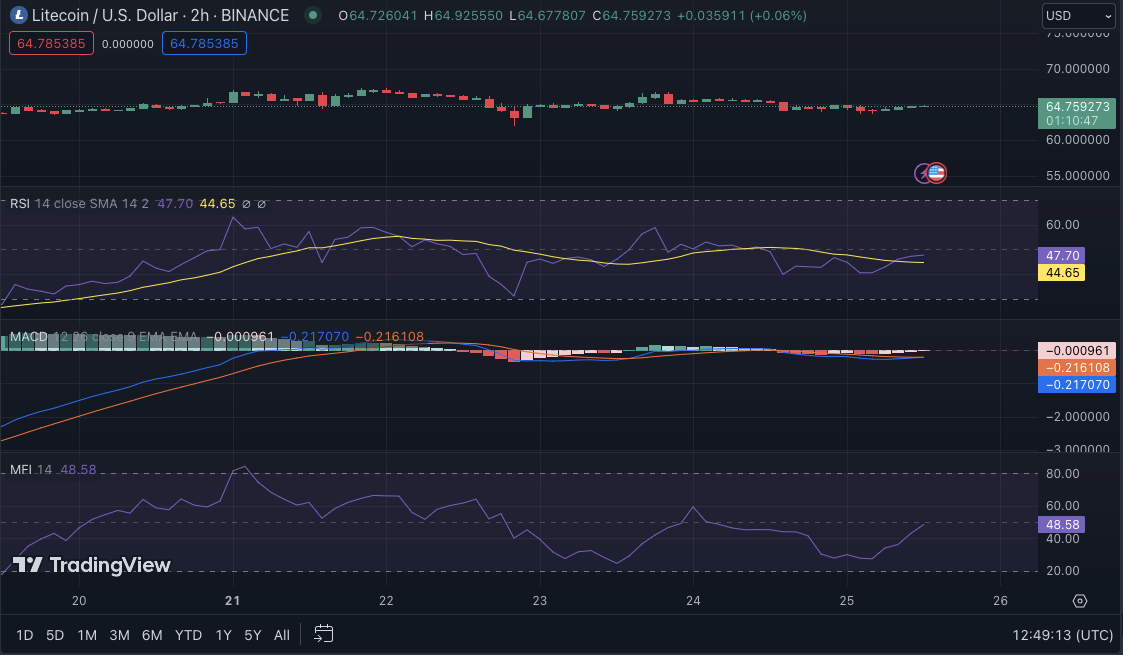
LTC/USD price chart (source: TradingView)
The Money Flow Index (MFI) points upward at 48.39, suggesting that buying pressure might increase. Hence, these indicators might signal a shift in market sentiment towards bullishness.
Despite these positive technical signs, Cowen’s analysis must be addressed. He points out that Litecoin’s rug pull cycles lead to lower highs, making it a hazardous choice for long-term investors. Besides, LTC has struggled to break past its resistance, casting a shadow of doubt on its future performance.
In conclusion, while technical indicators may point towards a potential reversal in bearish sentiment, the long-term outlook remains bleak. Investors should weigh the risk-reward equation carefully before diving in, especially when analysts have raised significant concerns.
Disclaimer: The views, opinions, and information shared in this price prediction are published in good faith. Readers must do their research and due diligence. Any action taken by the reader is strictly at their own risk. Coin Edition and its affiliates will not be liable for direct or indirect damage or loss.
Disclaimer: The information presented in this article is for informational and educational purposes only. The article does not constitute financial advice or advice of any kind. Coin Edition is not responsible for any losses incurred as a result of the utilization of content, products, or services mentioned. Readers are advised to exercise caution before taking any action related to the company.


