


- On-chain data shows that BTC may witness high liquidations between the $42,000 and $46,000 price marks.
- BTC’s price has fallen by almost 10% post-ETF approval.
- There has been a decline in BTC demand since 12 January.
Bitcoin liquidation heatmap assessed on a 3-day chart revealed that the coin’s market is prone to high liquidations between the $42,000 and $46,000 price ranges.
Liquidations occur when traders’ leveraged positions are forced to close because the price of BTC moves against them.
According to data from Coinglass, the BTC market recorded a high long liquidation of $112 million on 12 January, marking its second-highest long liquidation volume since the year began.
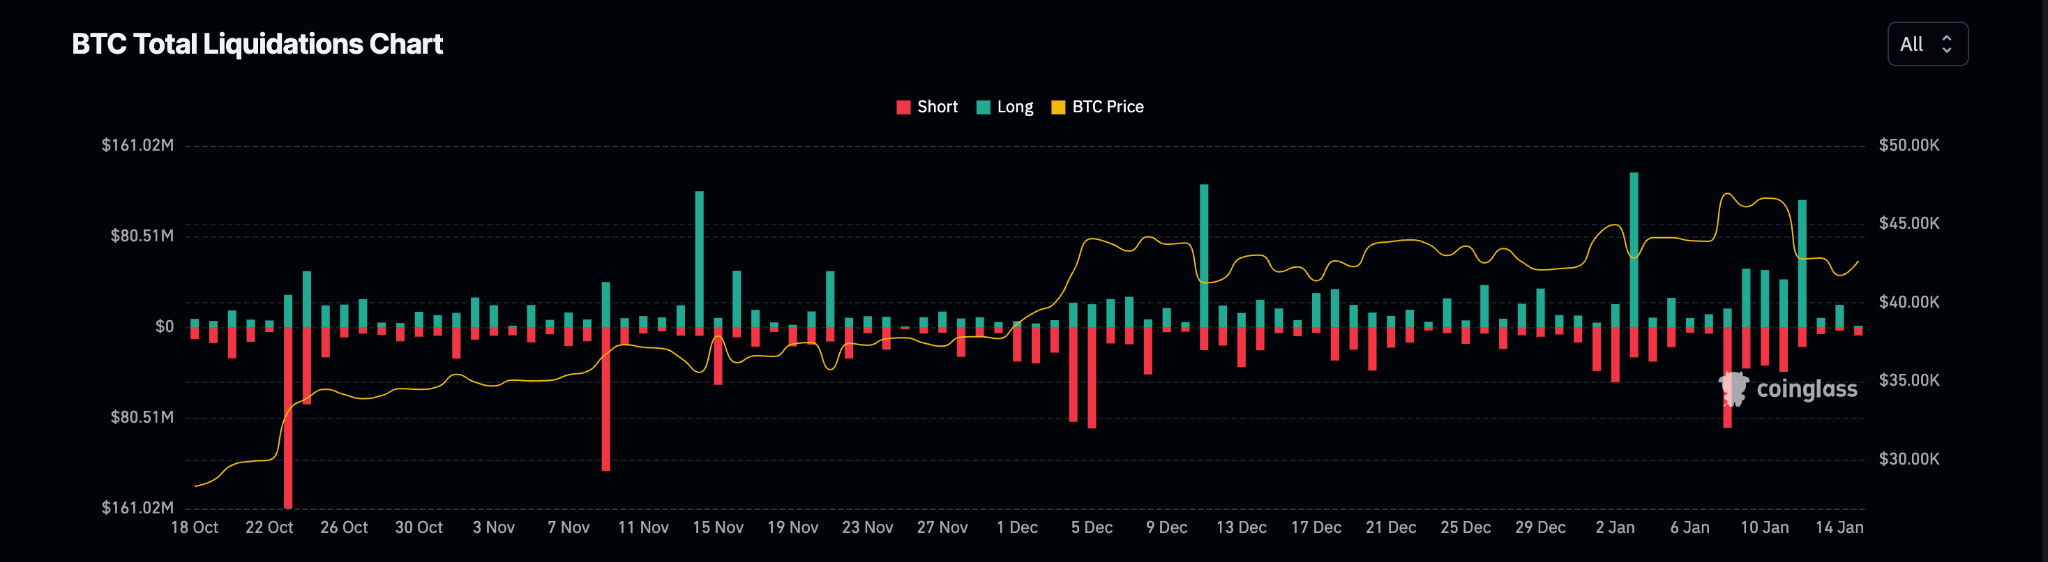
This coincided with the 7% price decline recorded on the same day, according to data from CoinMarketCap.
What is Next for BTC?
At press time, the leading crypto asset exchanged hands at $42,658. While many expected a surge above $50,000 post-ETF approval, BTC’s price has plummeted by almost 10% since then.
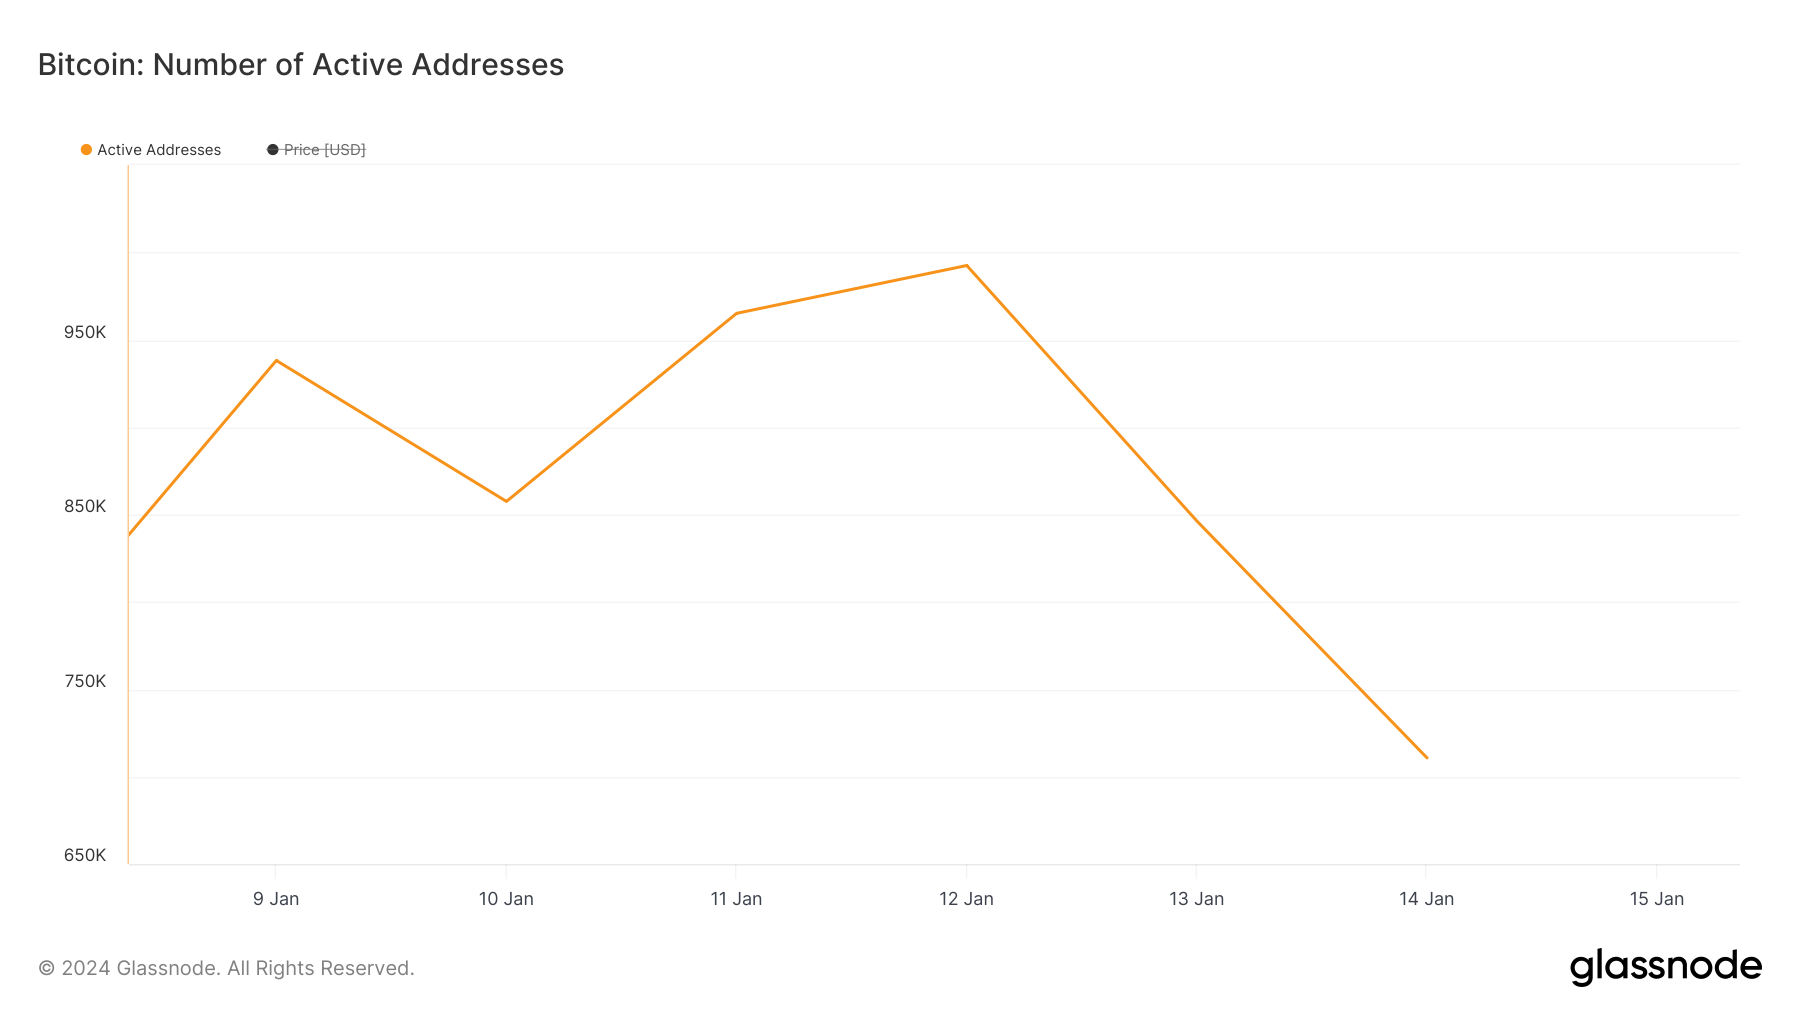
Daily demand for BTC peaked on 12 January and has since dwindled. On-chain data retrieved from Glassnode showed that the daily count of unique addresses involved in BTC transactions recorded a high of 992,491 on 12 January and has since fallen by 28%.
As of 14 January, only 710,706 unique addresses were active on the BTC network either as a sender or receiver.
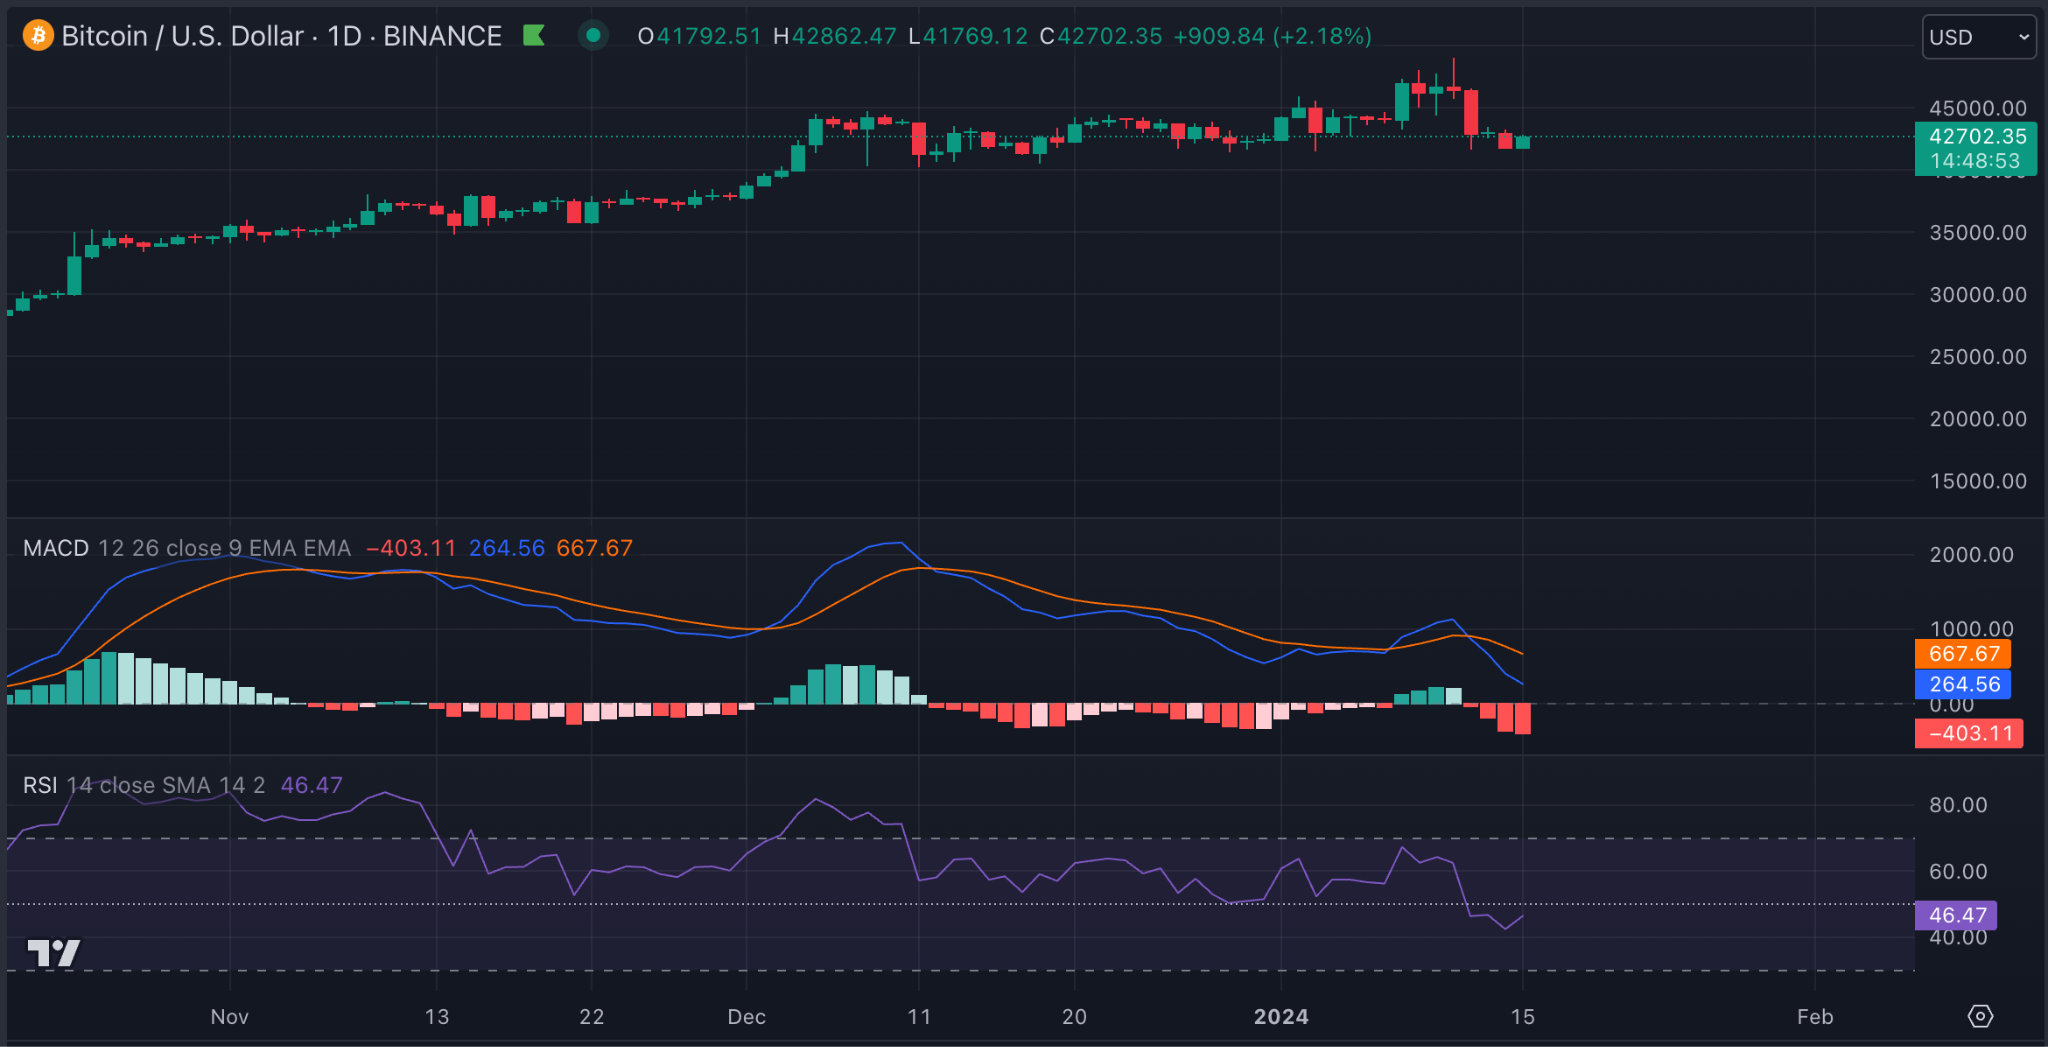
A look at BTC’s price movements on a daily chart revealed that the fall in demand for the coin coincided with a bearish crossover of its MACD line with its trend line. On 12 January, the MACD line crossed below the trend line to signal the re-entry of the bears into the market.
Signifying a rise in coin sell-offs, BTC’s Relative Strength Index (RSI) rested below the center line at press time. The momentum indicator returned a value of 46.66, suggesting that selling pressure exceeded coin accumulation.
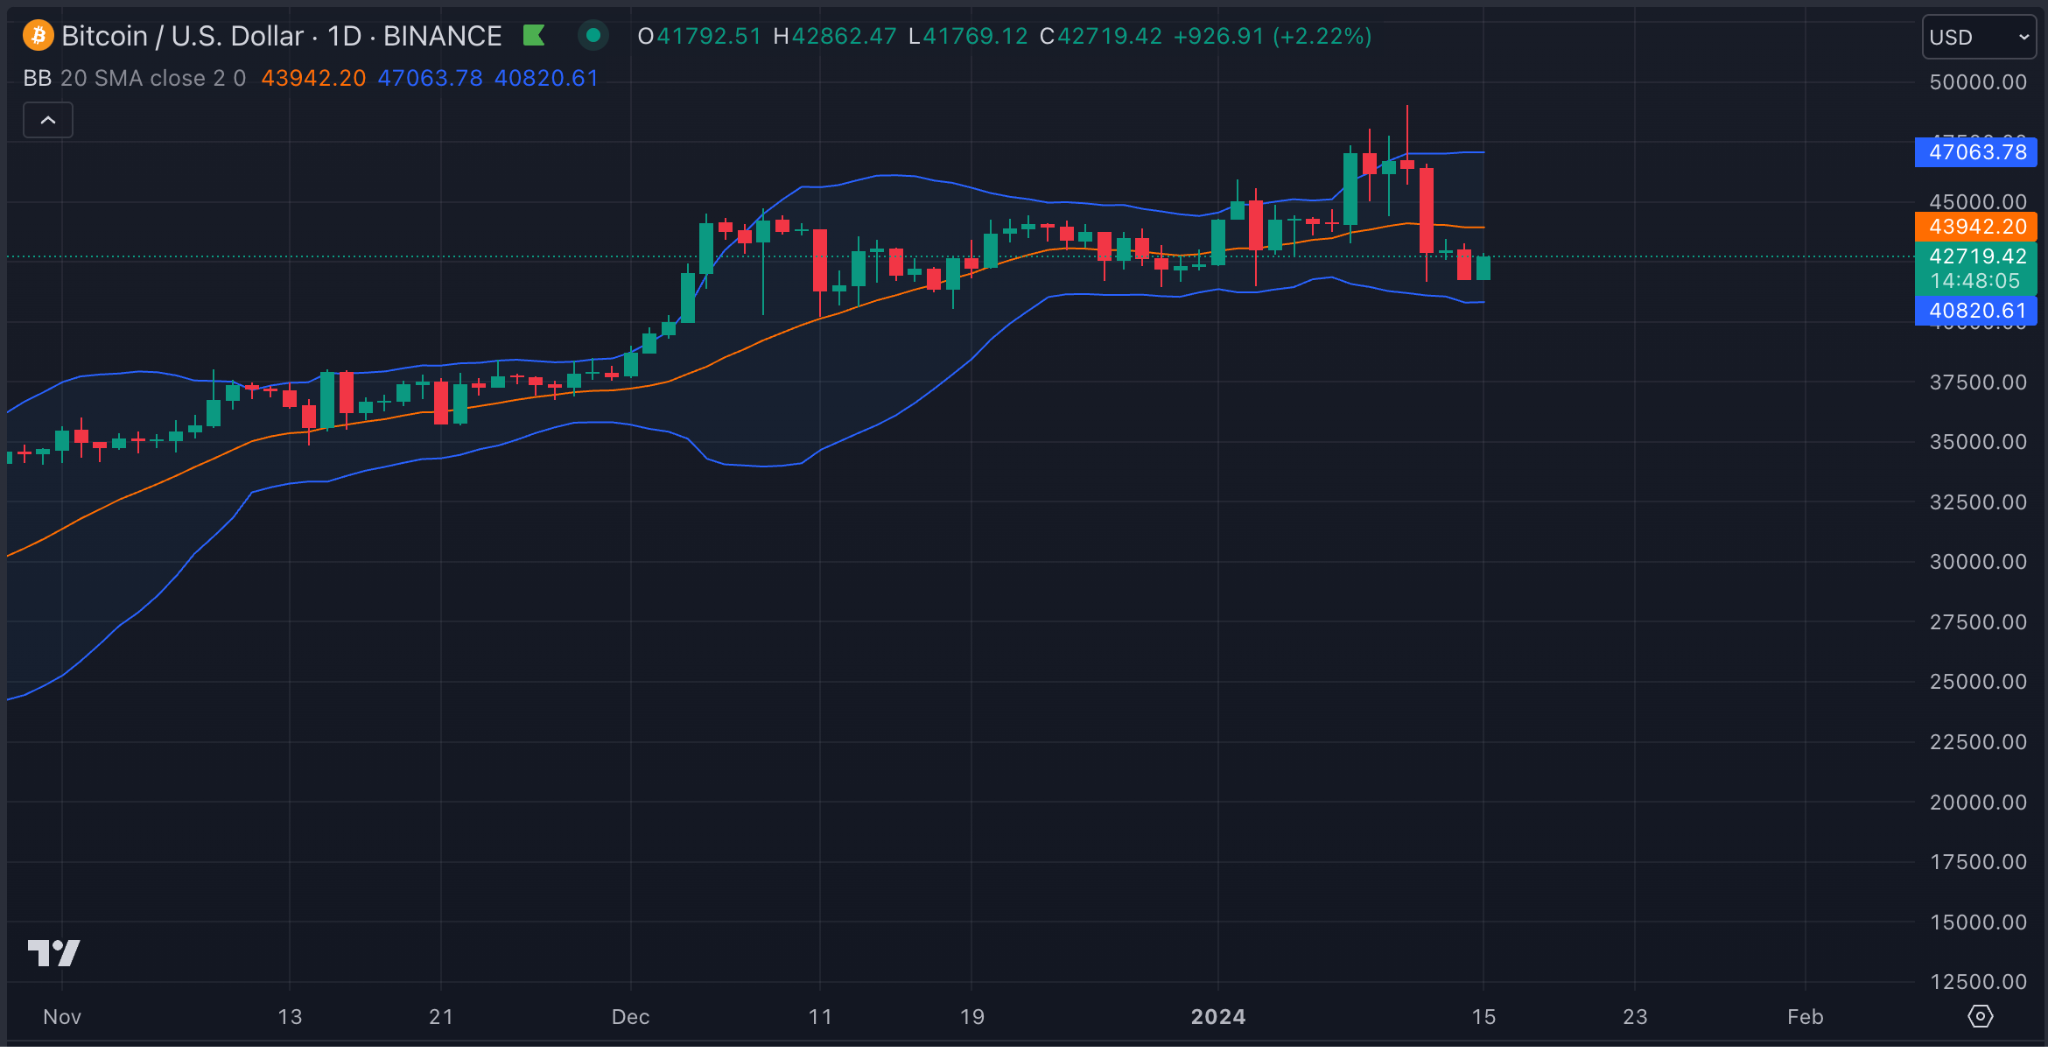
Further, since 12 January, market volatility has surged. The gap between the upper and lower bands of BTC’s Bollinger Bands (BB) indicator has since widened progressively.
When an asset sees an increase in the gap between the upper and lower bands of its BB indicator, it shows that its price is prone to severe fluctuations.
Disclaimer: The information presented in this article is for informational and educational purposes only. The article does not constitute financial advice or advice of any kind. Coin Edition is not responsible for any losses incurred as a result of the utilization of content, products, or services mentioned. Readers are advised to exercise caution before taking any action related to the company.
 Price Prediction 2026, 2027, 2028, 2029, 2030-2050")


