


- Decentraland traded in the green zone during the first few days but moved into the red zone later on.
- MANA has been fluctuating very close to the 200-day MA at times breakthrough.
- If MANA breakouts, it could either rebound on the 200-day MA or plunge shortly.
Decentraland’s (MANA) opening market price was $0.38 last Monday. Although MANA had a gloomy start in the red zone, as shown in the chart, it recovered and got to the green zone quickly. During its abode in the green zone, MANA reached a maximum of $0.3926.
MANA fluctuated between the $0.38-$0.39 price range in the green zone from December 12 to December 15, with most of its action being around its upper limit ($0.39). However, MANA’s abode in the green zone was shortlived as it entered the red zone and fluctuated more closely to $0.38. At times it tested the $0.38 limit but failed to break through.
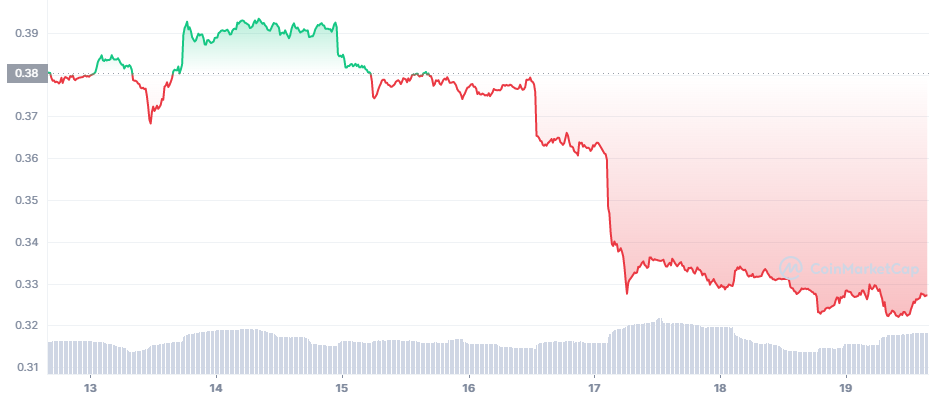
MANA plunged from $0.37 to 0.32 in less than 24 hours. Since reaching $0.32, MANA has been fluctuating in the $0.32-$0.34 price range. Currently, MANA is down 0.41% in the last 24 hours and is trading at $0.32, according to CoinMarketCap.
Interestingly as shown in the chart below, MANA has been fluctuating very close to the 200-day MA, at times testing it while at other times breaking through and rebounding on it.
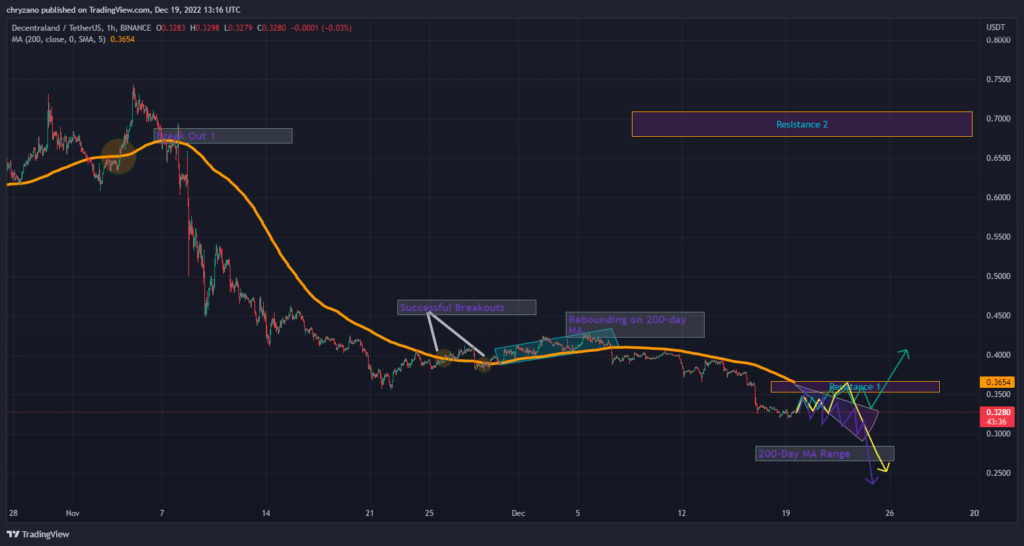
MANA made its first break out for the month on November 4. However, MANA could not capitalize on the momentum it gained as its prices fell below the 200-day MA shortly after breaking through. But, MANA tested the 200- day MA on a couple of occasions, as shown in the chart.
It broke through on both occasions, with the first breakout being short while the second breakout gave enough momentum for MANA to rebound on the 200-day MA.
There are three possible scenarios that MANA could follow: firstly, if MANA manages to break through the 200-day MA, it could rebound on it, as shown in the green line. Secondly, if MANA hits the 200-day MA line, it could hit Resistance 1 and plunge. Thirdly, if MANA fails to gain momentum to break out, it might follow the trajectory of 200-day MA from below.
Disclaimer: The views and opinions, as well as all the information shared in this price analysis, are published in good faith. Readers must do their own research and due diligence. Any action taken by the reader is strictly at their own risk, Coin Edition and its affiliates will not be held liable for any direct or indirect damage or loss.
Disclaimer: The information presented in this article is for informational and educational purposes only. The article does not constitute financial advice or advice of any kind. Coin Edition is not responsible for any losses incurred as a result of the utilization of content, products, or services mentioned. Readers are advised to exercise caution before taking any action related to the company.
 Price Prediction 2026, 2027, 2028, 2029, 2030-2050")


