


 Price Prediction 2024-2030: Will OM Token Reach $5 Soon?")
Since its inception in 2020, MANTRA (OM) has gained significant traction in the blockchain and DeFi. The platform’s integration of various DeFi services has made it a notable player in the market. Recent market activities reflect its dynamic growth and adaptation to the rapidly evolving crypto environment, with the token recently hitting its all-time high.
MANTRA (OM) has been actively expanding its ecosystem through strategic partnerships and continuous protocol updates to enhance user experience and security. MANTRA (OM) has substantially increased its user base and transaction volumes in the past year.
The platform’s native token, OM, has experienced fluctuations typical of the volatile crypto market, yet it maintains a strong presence among DeFi tokens. Its staking and lending services have attracted a significant amount of locked value, indicating trust and engagement from the community. MANTRA (OM) has also improved its governance model, allowing for more efficient and transparent decision-making processes.
Table of contents
- What is MANTRA (OM)?
- MANTRA (OM) Market Status
- MANTRA (OM) Price Analysis: Moving Average Convergence Divergence
- MANTRA (OM) Price Analysis: Relative Strength Index (RSI)
- MANTRA (OM) Price Analysis: Bollinger Bands
- MANTRA (OM) Price Prediction 2024 -2030 Overview
- MANTRA (OM) Price Prediction 2024
- MANTRA (OM) Price Prediction 2025
- MANTRA (OM) Price Prediction 2026
- MANTRA (OM) Price Prediction 2027
- MANTRA (OM) Price Prediction 2028
- MANTRA (OM) Price Prediction 2029
- MANTRA (OM) Price Prediction 2030
- FAQs
What is MANTRA (OM)?
MANTRA (OM) is a decentralized blockchain ecosystem initially known as MANTRA DAO. The platform was built to leverage the benefits of decentralized finance (DeFi) and community governance. MANTRA’s architecture integrates several blockchain technologies to create a versatile and inclusive ecosystem. The platform operates on transparency, community control, and financial inclusion principles, offering various DeFi services such as staking, lending, and governance.
At its core, MANTRA (OM) employs a decentralized autonomous organization (DAO) model, which empowers its community members to have a say in decision-making. This governance model is fundamental to its operation, allowing token holders to propose and vote on important matters such as protocol upgrades, new features, and other significant changes. This participatory governance ensures that the ecosystem evolves according to its diverse user base’s collective interests and insights, fostering a sense of ownership and engagement among participants.
MANTRA (OM) also aims to create a seamless and integrated DeFi experience by offering various financial products and services. These include staking pools, lending platforms, and yield farming opportunities designed to provide users with numerous avenues for generating returns on their crypto assets.
By integrating these features within a single ecosystem, MANTRA (OM) simplifies the user experience and enhances the potential for synergistic growth within the DeFi space. The ecosystem’s commitment to innovation and community-driven development positions it as a significant player in the evolving world of decentralized finance.
MANTRA (OM) Market Status
The MANTRA OM token has been riding a wave of bullish momentum over the past month, with its price surging over 64% during a six-week rally. This upward trend took off on September 2, pushing the token beyond its all-time high of $1.41, last seen on July 21. Today, it has set a new record, touching $1.47. As investor confidence grows, the OM token shows no signs of slowing down, continuing to gather strength and attention in the market.
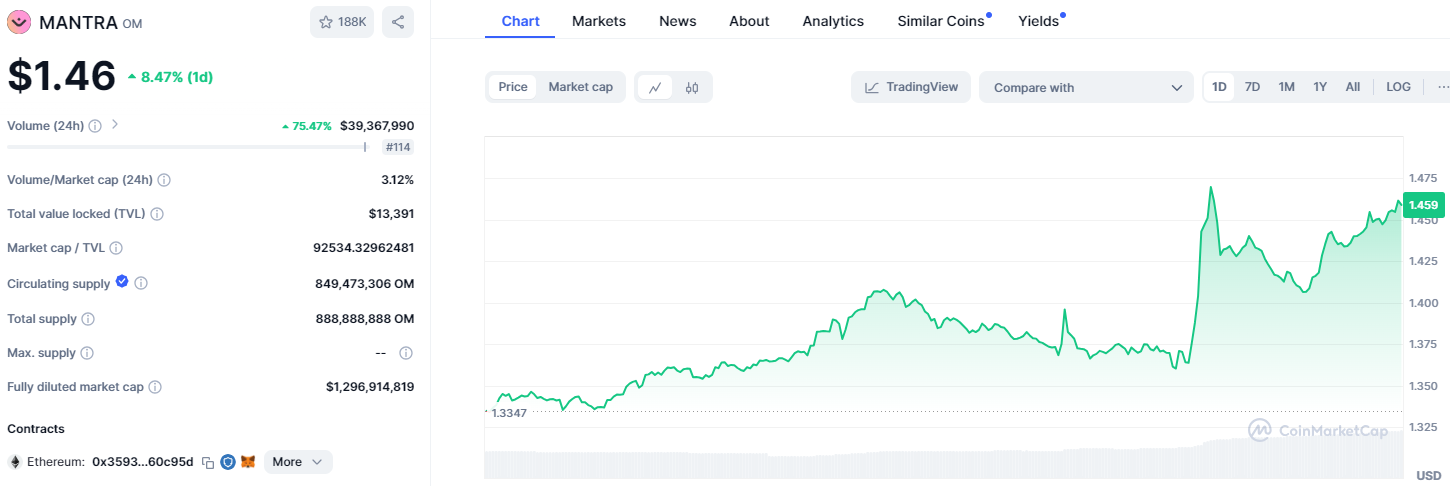
CoinMarketCap’s latest data highlights this bullish sentiment on the daily chart, with the OM token currently trading at $1.46, reflecting an impressive 8.49% gain in the last 24 hours alone. The surge has also propelled the token’s market cap to a new height of $1.239 billion, solidifying its spot at 60 in the global crypto rankings.
But it doesn’t end there—OM’s trading volume has skyrocketed, climbing by 75.47% within a day, reaching $39.367 million. This spike in trading activity signals growing enthusiasm and could signify further bullish movement on the horizon. With market interest intensifying, the stage is set for continuing this upward trend as investors eagerly watch the OM token’s next moves.
MANTRA (OM) Price Analysis: Moving Average Convergence Divergence
The MACD indicator is signaling a bullish divergence, with a recent crossover above the signal line, currently positioned at 0.183723 and trending upwards. This upward momentum suggests that bulls still have control, and further gains could be in store.
The MACD histogram shows expanding green bars above the zero line, supporting this outlook and confirming a strengthening bullish trend. If this continues, it could drive the MANTRA OM token to new all-time highs and uncharted territory for the asset.
MANTRA (OM) Price Analysis: Relative Strength Index (RSI)
In line with these indicators, the RSI shows the OM token maintaining its bullish momentum. It’s trending upwards and above its signal line, highlighting continued buying pressure. However, with the RSI nearing 68.86, it’s approaching overbought territory—suggesting a potential consolidation or pullback may be looming.
A lower-level dip could offer support, but if the RSI persists in these overbought conditions, the token could defy expectations and push even higher, propelled by eager investors.
MANTRA (OM) Price Analysis: Bollinger Bands
The Bollinger Bands indicator also reflects a long-term bullish outlook for MANTRA OM. The widening of the bands indicates increased volatility, often a precursor to sharp price movements. The token’s price hugging the upper band points to solid buying pressure, though it also hints at a possible pullback or correction soon.
A retracement could bring the price down to the middle band, near the $1.02 level, offering potential support. Yet, if buying interest remains strong, the token could break through resistance levels, extending its bullish run even further.
MANTRA (OM) Price Prediction 2024 -2030 Overview
| Price Prediction | Potential Low ($) | Average Price ($) | Potential High ($) |
| 2024 | $0.3612 | $0.9169 | $3.82 |
| 2025 | $1.08 | $2.07 | $4.77 |
| 2026 | $2.51 | $3.1327 | $5.87 |
| 2027 | $2.92 | $3.82 | $6.94 |
| 2028 | $4.27 | $6.38 | $9.75 |
| 2029 | $6.74 | $8.91 | $13.69 |
| 2030 | $9.80 | $15.99 | $20.25 |
MANTRA (OM) Price Prediction 2024
In 2024, the price of 1 MANTRA is projected to reach a minimum level of $0.3612. Throughout the year, the OM price could achieve a maximum level of $3.82, with an average price of approximately $0.9169.
MANTRA (OM) Price Prediction 2025
In 2025, the price of MANTRA is forecasted to reach a minimum value of $1.08. Throughout the year, the MANTRA price is expected to attain a maximum value of $4.77, with an average trading price of $2.07.
MANTRA (OM) Price Prediction 2026
Based on our technical analysis of historical price data for OM, the price of MANTRA in 2026 is anticipated to reach a minimum level of $2.51. The OM price could attain a maximum level of $5.87, with an average trading price of $3.1327 throughout the year.
MANTRA (OM) Price Prediction 2027
The price of MANTRA is projected to reach a minimum level of $2.92 in 2027. According to our analysis, the OM price could achieve a maximum level of $6.94, with an average forecasted price of $3.82.
MANTRA (OM) Price Prediction 2028
According to the forecast price and technical analysis, the cost of MANTRA in 2028 is expected to reach a minimum level of $4.27. The OM price could climb to a maximum of $9.75, with an average trading price of $6.38.
MANTRA (OM) Price Prediction 2029
The price of MANTRA is expected to reach a minimum level of $6.74 in 2029. Based on our analysis, the OM price could rise to a maximum of $13.69, with an average forecasted price of $8.91.
MANTRA (OM) Price Prediction 2030
Based on our detailed technical analysis of past price data for OM, the price of MANTRA in 2030 is anticipated to reach a minimum value of $9.80 and a maximum of $20.25, with an average trading value of $15.99 in USD.
FAQs
MANTRA OM (OM) is a decentralized finance (DeFi) platform leveraging blockchain technology to offer financial services such as staking, lending, and governance. It emphasizes community involvement, allowing token holders to participate in decision-making. OM tokens are used for transactions, governance, and incentives.
To buy MANTRA (OM), create an account on a reliable cryptocurrency exchange that supports OM trading. Deposit funds into your account, search for OM, and execute a buy order. Ensure you transfer the purchased OM tokens to a secure wallet for safekeeping.
Coin Edition analysis forecasts OM tokens to peak at $20.25 by 2030. However, investors should invest carefully and monitor it to have a hedge.
The highest MANTRA (OM) price was $1.47, recorded on October 7, 2024.
OM has a circulating supply of 793,991,274 OM coins and a total supply of 888,888,888 OM.
The OM token price is poised to continue its healthy upward movement, surpassing the crucial threshold at $1.47. According to our analysis, the OM token is envisioned to surpass its all-time high mark by the end of 2024.
The lowest price of NOT is $0.01728, according to CoinMarketcap’s data.
The founders of MANTRA (OM) are John Patrick Mullin, Rodrigo Quan, and Will Corkin. They established the platform with a focus on decentralized finance and community governance.
MANTRA (OM) was launched in 2020.
To store MANTRA (OM), use a compatible cryptocurrency wallet such as Ledger (hardware wallet) or MetaMask (software wallet). Ensure the wallet supports ERC-20 tokens, transfer OM tokens from the exchange to your wallet address, and securely back up your wallet’s private keys.
The price of OM is forecasted to hit the $3.82 zone in 2024.
There is a possibility of OM reaching a maximum value of $4.77 by 2025,
By 2026, OM’s valuation might ascend to a peak of $ $5.87.
Looking ahead to 2027, OM is expected to achieve a maximum valuation of up to $6.94.
By 2028, analysis shows that the maximum valuation of OM tokens will peak at $9.75.
The maximum valuation of OM tokens is predicted to hit a maximum of $13.69 in 2029.
Coin Edition analysis forecasts OM tokens to reach a maximum valuation of $20.25.
Disclaimer: The information presented in this article is for informational and educational purposes only. The article does not constitute financial advice or advice of any kind. Coin Edition is not responsible for any losses incurred as a result of the utilization of content, products, or services mentioned. Readers are advised to exercise caution before taking any action related to the company.


