, While Bears Take the Helm")
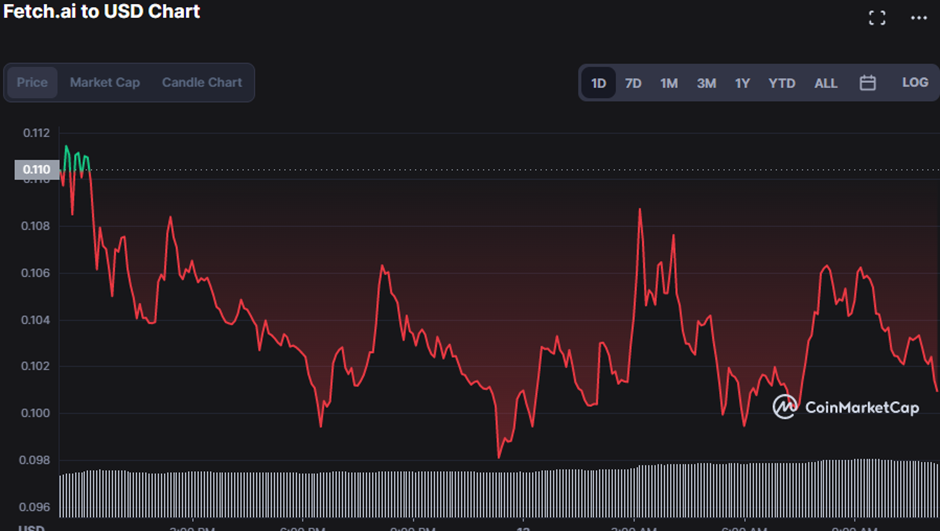
- According to recent research, market volatility in the FET market is decreasing.
- FET prices find support throughout the fall around $0.09789.
- Will the bulls overturn this bearish momentum?
Fetch.ai (FET) has stayed in the hands of bears because market prices have steadily decreased until they hit support at $0.09789. However, during the day, bullish pressure drove FET prices to an intra-day high of $0.1119
Negative momentum managed to dip prices to $0.1002 during the downturn, a 9.57% decline.
The bear’s strength is increasing, as evidenced by a 10.03% decrease in market capitalization to $74,970,625 and a 23.09% increase in 24 hour trading volume to $76,849,771, indicating that selling pressure exists as investors are selling their shares.
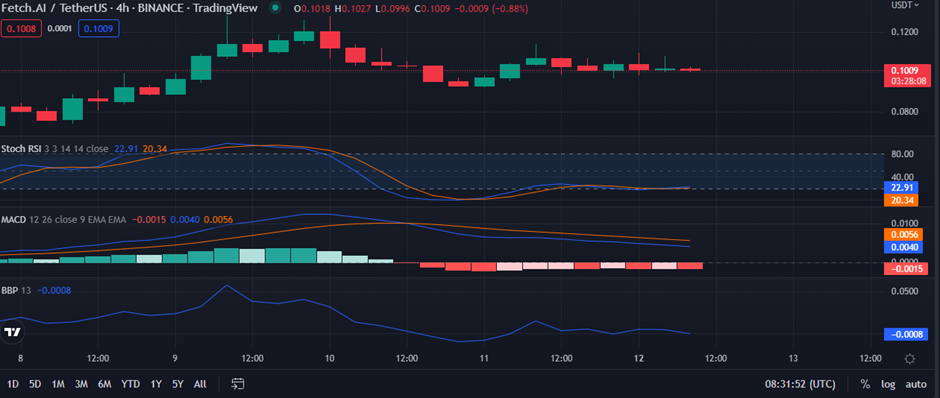
The appearance of a red engulfing candlestick on the 4-hour price chart lends credence to this bearish viewpoint. Adding on, the stochastic RSI’s movement towards the oversold level, with a reading of 22.27, is causing investors to be concerned. At this level, bear momentum is expected to continue because bull power is waning, but bulls may seize the market because it is heading north.
A bearish trend is anticipated if the blue Moving Average Convergence Divergence (MACD) falls below the signal line. This is seen by the MACD line touching 0.0041 on the Fetch.ai price chart. The movement of the histogram into the negative zone also increases the likelihood of a bearish trend prevailing in the market.
Also, the Bull Bear Power (BBP) movement in the negative zone, which can be seen on the FET price chart as a value of -0.0005, shows that the recession is still going on.
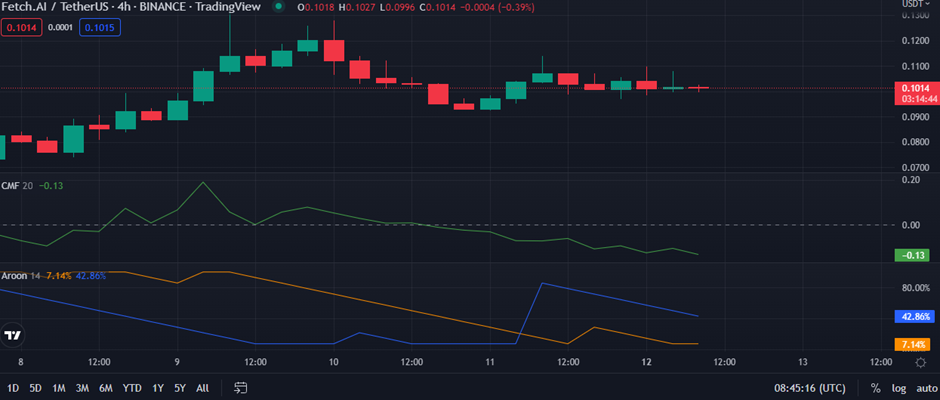
When the Aroon-Up crosses below the Aroon-Down, it signals the start of a new downtrend. This is seen on the FET price chart, where the aroon up (orange) with a value of 7.14% crosses below the aroon down (blue) with a value of 42.86%, suggesting that the current bear run has not reached its apex.
The Chaikin Money Flow (CMF) indicator on the FET 4-hour price chart drops below zero, reaching -0.13. If bulls don’t step in, this CMF pattern indicates further bear dominance.
The digital currency may witness a positive reversal if the FET bulls can maintain the resistance level despite multiple indicators pointing to another bear run.
Disclaimer: The views and opinions, as well as all the information shared in this price analysis, are published in good faith. Readers must do their own research and due diligence. Any action taken by the reader is strictly at their own risk, Coin Edition and its affiliates will not be held liable for any direct or indirect damage or loss.
Disclaimer: The information presented in this article is for informational and educational purposes only. The article does not constitute financial advice or advice of any kind. Coin Edition is not responsible for any losses incurred as a result of the utilization of content, products, or services mentioned. Readers are advised to exercise caution before taking any action related to the company.
")


