- Polygon price analysis finds MATIC is in a firm bullish trend.
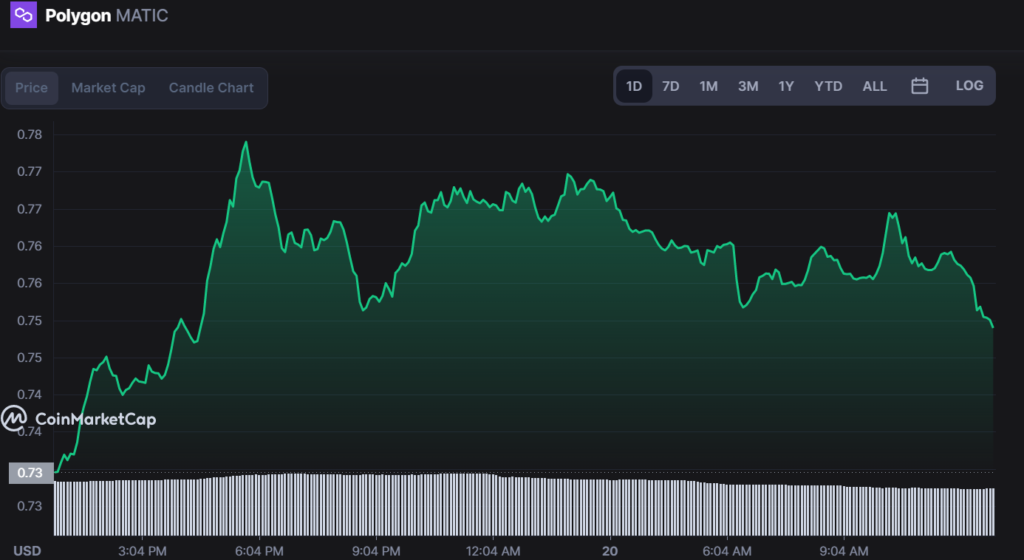
- Polygon is up by 2.42%.
- Polygon has been on a steady uptrend in the last 24 hours.
Polygon price analysis reveals that the MATIC price consolidation fell below $0.758 on September 19, which signals that people are selling and stopping their liquidity runs.

The bulls managed to push the price back up to $0.7587 on September 20, which signifies that they are still in control of the market. The buyers need to push the price above $0.76 to invalidate the bearish setup and start a new rally. On the other hand, if the bears push the price below $0.755, it would signal that they are back in control of the market.
Over the last 48 hours, MATIC’s price saw a surge in selling pressure that broke through its previous range, causing it to drop even further. As a result, Polygon was able to collect the sell-stop liquidity that was resting below equal lows.
As the market consolidates, the bulls are trying to push the price up to retest the resistance at $0.76. If they succeed, it would invalidate the bearish setup and could start a new rally.
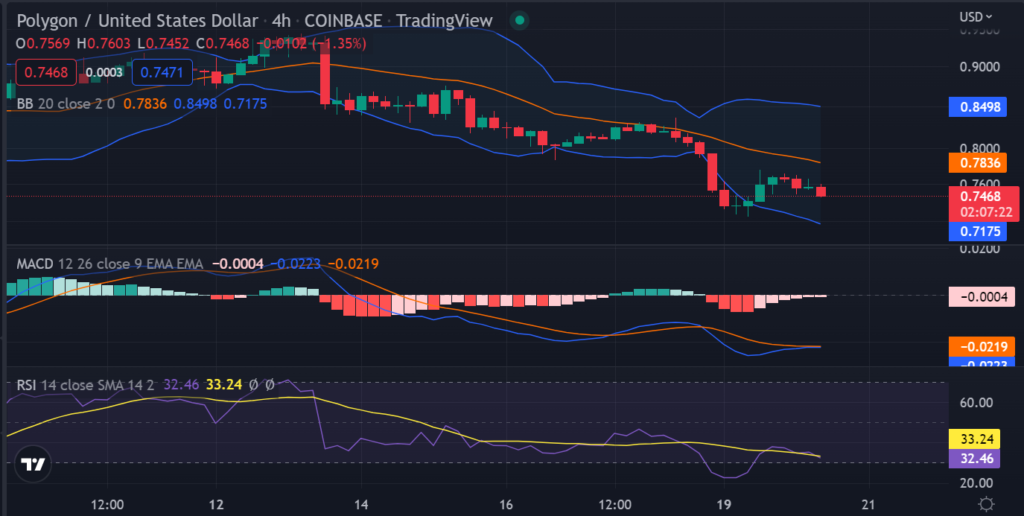
The technical indicators are positive and indicate that the bulls are in control of the market. Meanwhile, the market is currently above the 20-day moving average ($0.754) and the 50-day moving average ($0.751), which is a sign that the bulls are in control of the market.
The RSI (Relative Strength Index) is currently at 62, which is not in overbought or oversold territory, which is a sign that the market is in a healthy state. The Bollinger Bands have expanded, which is a sign that the market is volatile and that a breakout is likely. The upper band is at $0.762 and the lower band is at $0.752. These levels act as both support and resistance for the market.

The MACD (Moving Average Convergence Divergence) is currently in the bullish zone, but it is close to the centerline, which is a sign that the market could be range-bound for some time.
Overall, the market is in a bullish state as the bulls have pushed the price above the $0.755 level. The next level to watch for a breakout is $0.76. A break above this level would invalidate the bearish setup and start a new rally.
On the other hand, if the bears push the price below $0.755, it would signal that they are back in control of the market. The next level to watch for a breakdown is $0.75. A break below this level would confirm that the bulls are losing control of the market.
Disclaimer: The information presented in this article is for informational and educational purposes only. The article does not constitute financial advice or advice of any kind. Coin Edition is not responsible for any losses incurred as a result of the utilization of content, products, or services mentioned. Readers are advised to exercise caution before taking any action related to the company.


