


- MEME price rebounds by 4.69% after testing crucial support at $0.03582.
- Despite a drop in trading volume, MEME’s market capitalization rose by over 4%.
- Indicators hint at strengthening bullish sentiment, but caution is advised as MEME approaches overbought territory.
In the early hours of the day, bears in the Memecoin (MEME) market had the upper hand, with the price plummeting to an intra-day low of $0.03582, where it reached a crucial support level. However, as the day progressed, bulls reclaimed control and pushed the price back to $0.043601, indicating a possible shift in market mood. However, resistance was met at this level, causing the price to consolidate and trade within a restricted range.
On the other hand, Bears seized the opportunity to sell at this resistance level, putting downward pressure on the price. As a result, the MEME price dropped to $0.03899 before finding support and recovered to $0.03988, representing a 4.69% increase from the intra-day low.
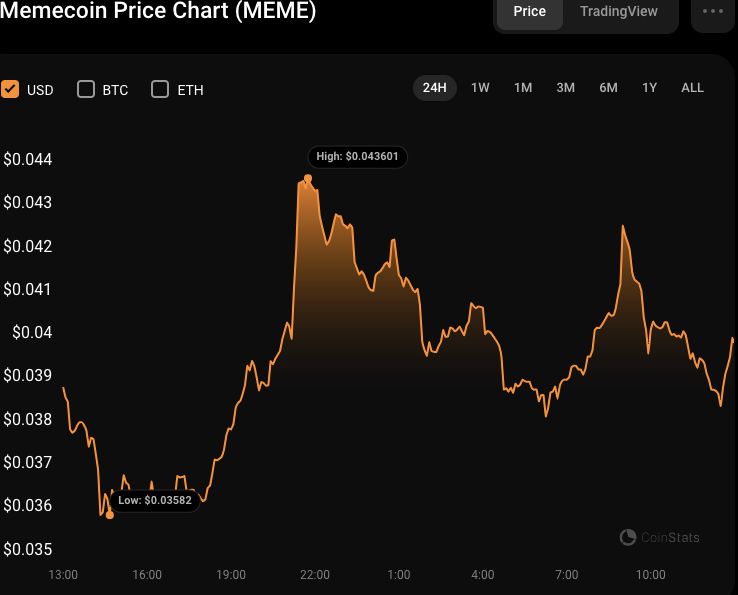
The market capitalization of MEME increased by 4.91% to $351,581,942, but its 24-hour trading volume decreased by 32.45% to $566,034,734. This trend suggests that, despite the early barrier, MEME still has bullish momentum in the market. The drop in trading volume reflects a drop in overall market activity, possibly due to investors becoming cautious.
MEME/USD Technical Analysis
The Moving Average Convergence Divergence (MACD) on the 24-hour price chart has risen above its signal line after briefly falling below. Despite being in the negative zone, this shift and upward movement imply that MEME’s bullish momentum may be strengthening.
If the MACD line remains above the signal line and climbs further into positive territory, it may indicate a possible uptrend for MEME. This bullish momentum is also supported by the histogram move into the positive region, which implies an increase in purchasing pressure.
Furthermore, the stochastic RSI movement upward with a rating of 69.02 shows that MEME is approaching overbought territory. This pattern suggests rising MEME demand and the possibility of more price hikes. However, investors should be cautious because an overbought scenario could lead to a quick reversal.
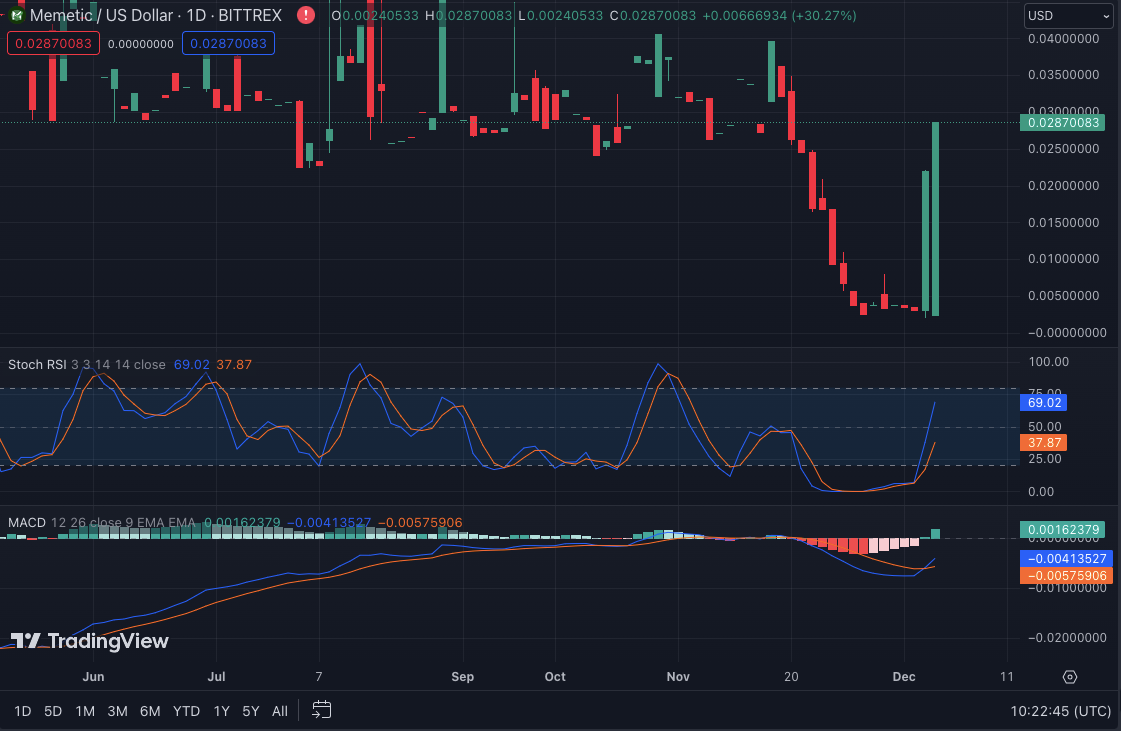
In conclusion, MEME’s market witnessed a tug-of-war between bears and bulls, but signs of bullish momentum are emerging. With the MACD and stochastic RSI pointing upwards, caution is warranted as MEME approaches potential overbought territory.
Disclaimer: The information presented in this article is for informational and educational purposes only. The article does not constitute financial advice or advice of any kind. Coin Edition is not responsible for any losses incurred as a result of the utilization of content, products, or services mentioned. Readers are advised to exercise caution before taking any action related to the company.


