 Price Prediction For June 25 2025")
The Movement (MOVE) price today is trading around $0.1607 after a vertical rally that propelled price nearly 45% from the previous week’s lows. The rally was triggered by a breakout from a long-standing downtrend structure, with strong momentum indicators flashing bullish signals.
However, short-term exhaustion signs are emerging as the price faces resistance and divergence on lower timeframes. The question now is whether bulls can build a base above $0.152 or if we’ll see a short-term retracement.
What’s Happening With Movement (MOVE)’s Price?
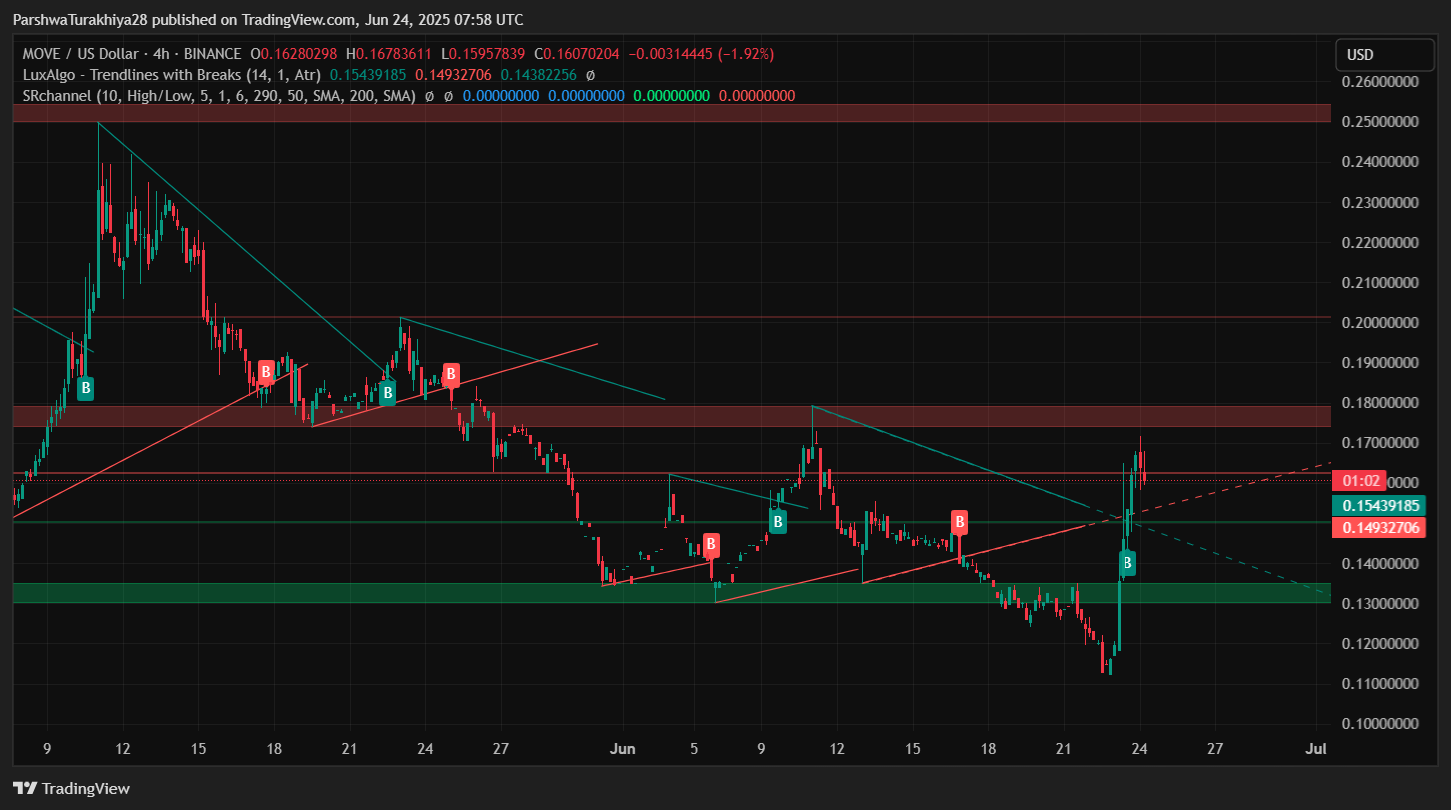
The recent surge in Movement (MOVE) price action follows a clean breakout from a falling channel and reclaim of the demand zone around $0.125–$0.137. This zone had previously acted as a liquidity pool, which once flipped supported the aggressive push toward $0.17.
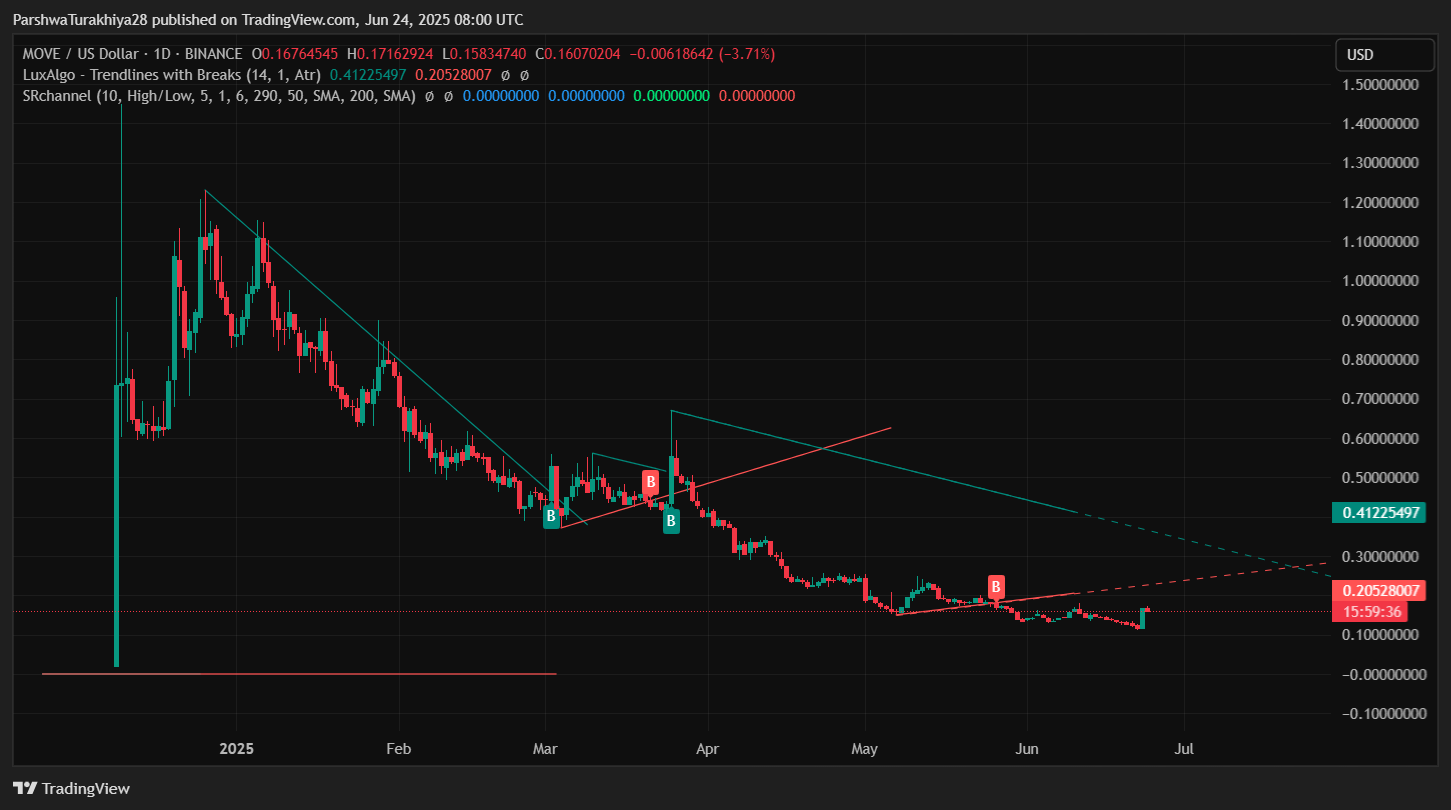
On the daily chart, MOVE also pierced through the key descending trendline from its March peak, signaling a structural break. Meanwhile, the 4-hour chart confirms bullish price structure with higher highs and strong volume through resistance near $0.149 and $0.154.
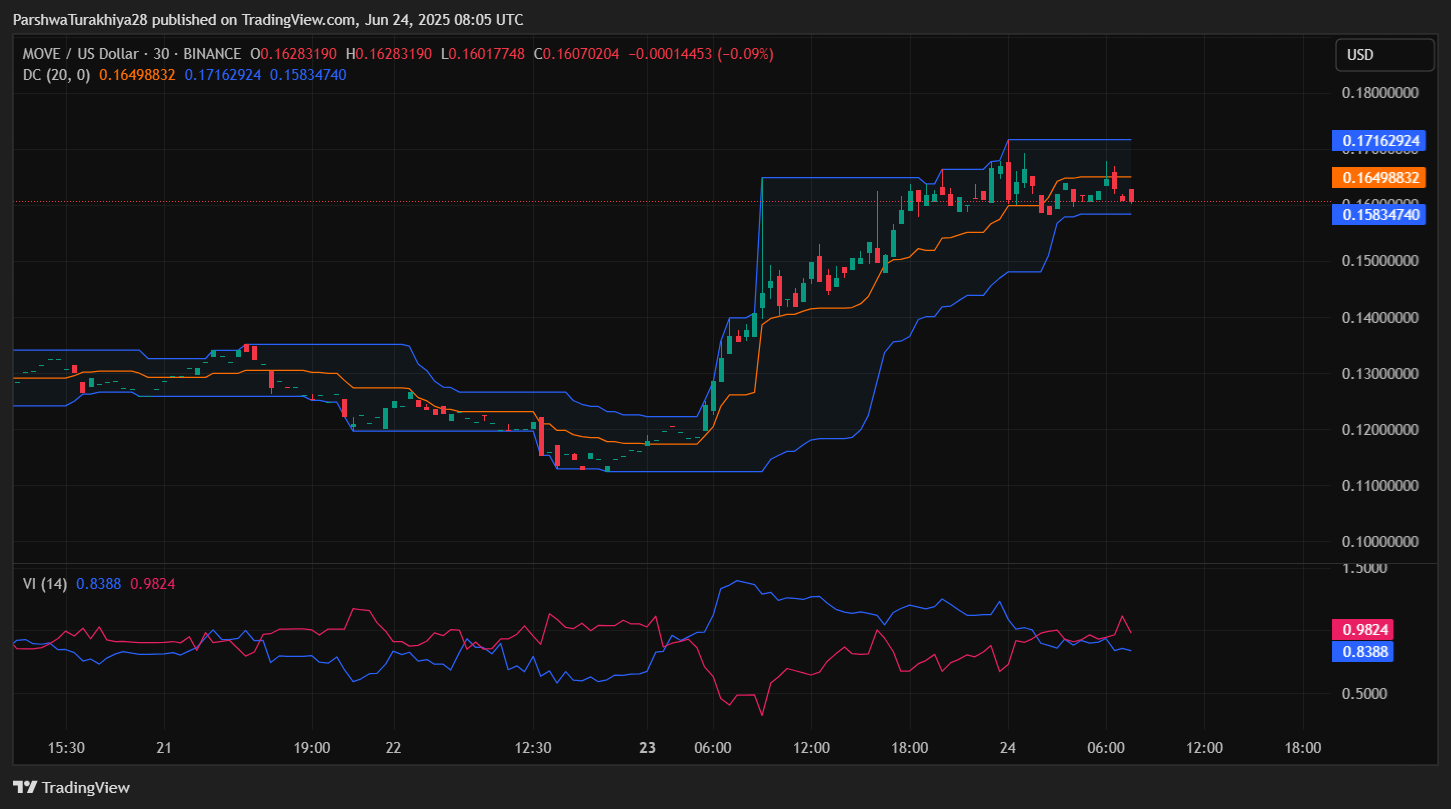
Despite the bullish shift, current candles show signs of tightening near the $0.165–$0.171 range. Donchian Channels show MOVE is pinned near the upper band, suggesting an overheated move and possible range formation unless $0.171 is breached cleanly.
RSI Divergence And MACD Flattening Warn Of Short-Term Fatigue
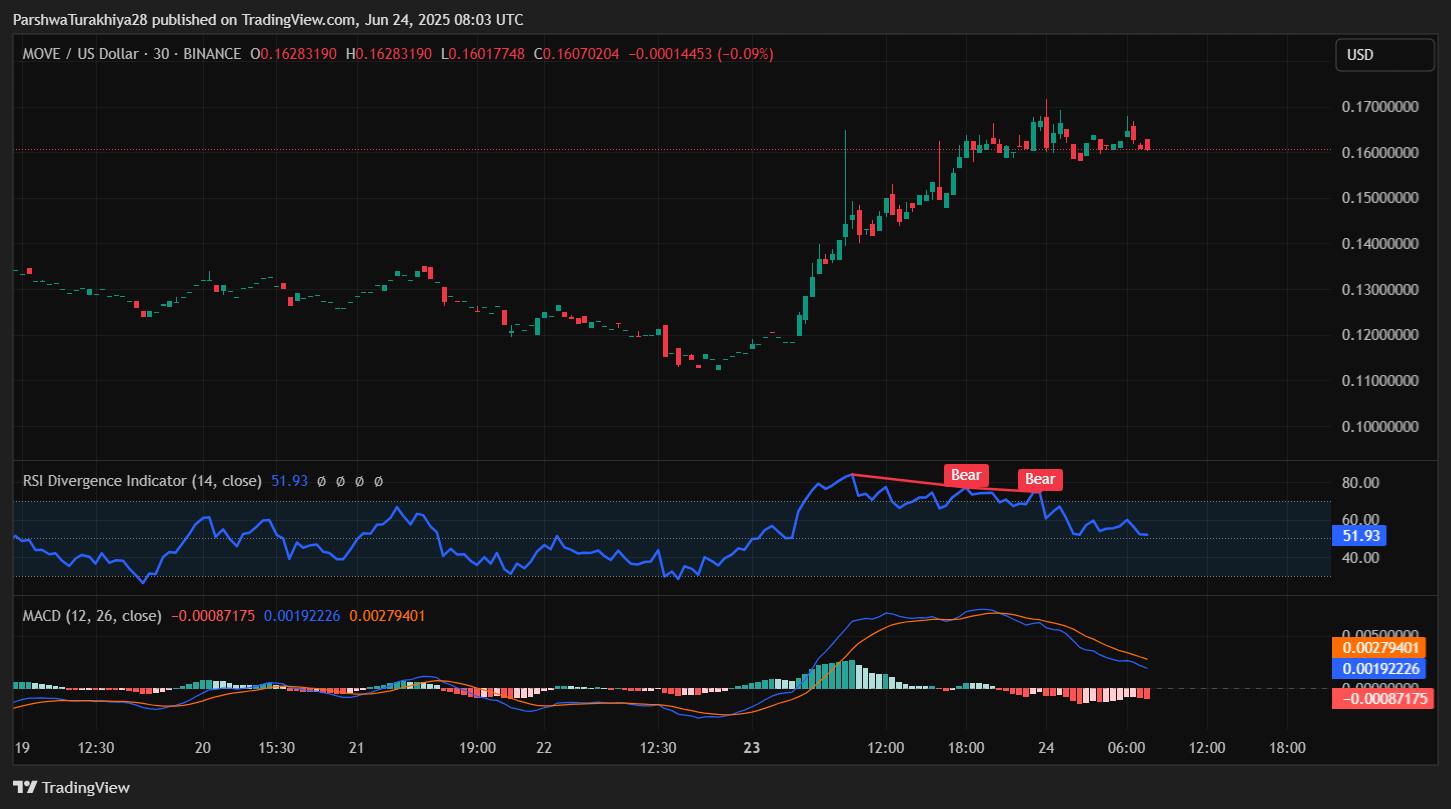
Although MOVE remains bullish in structure, short-term indicators hint at weakening momentum. On the 30-minute chart, RSI has formed multiple bearish divergence tags while price remains sideways—an early sign of a potential pullback. MACD also shows a soft crossover below the signal line, with histogram flattening.
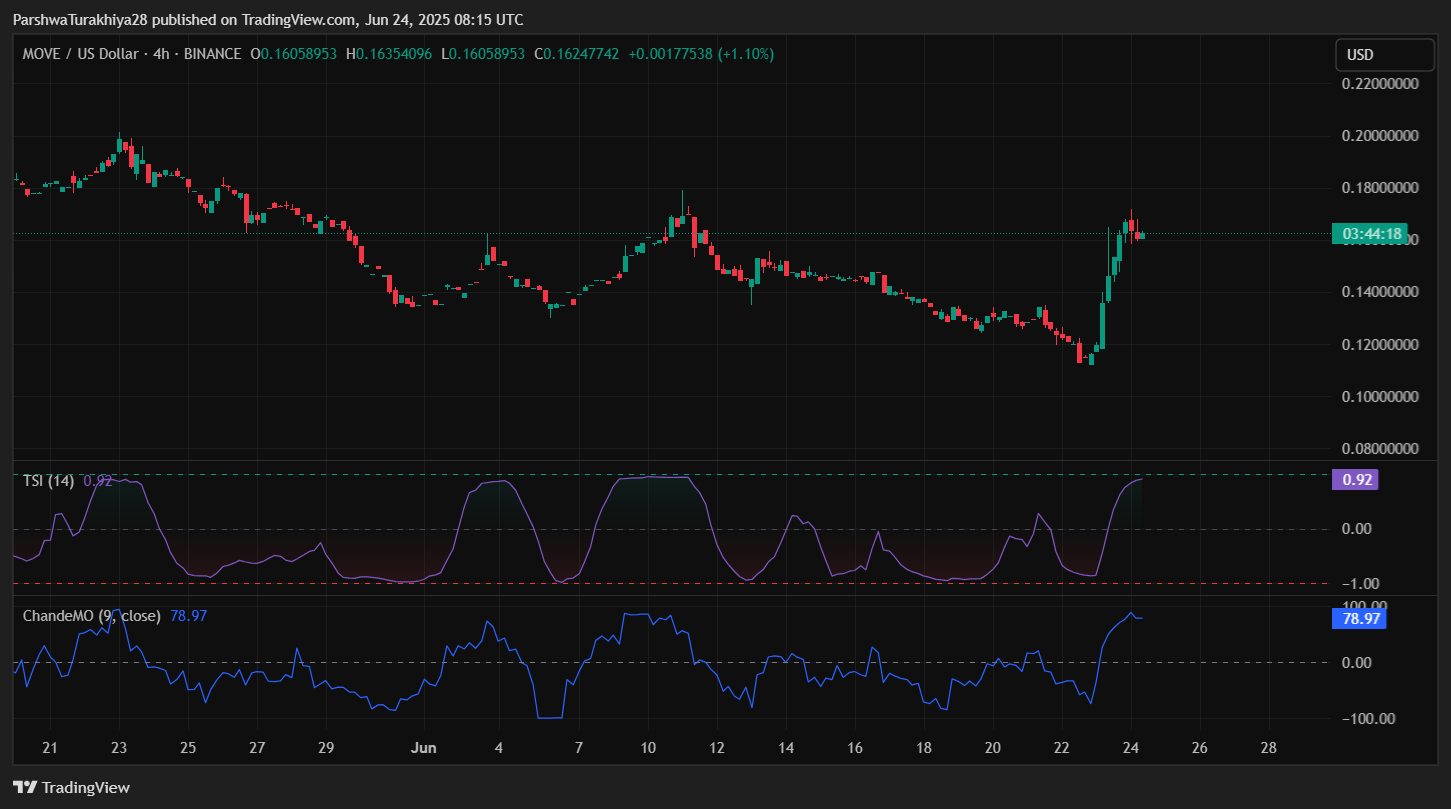
This divergence is important as it emerges just after a parabolic move. Chande Momentum Oscillator and TSI also reflect a fading impulse above 78 and +0.92, respectively—both indicating momentum is no longer building.
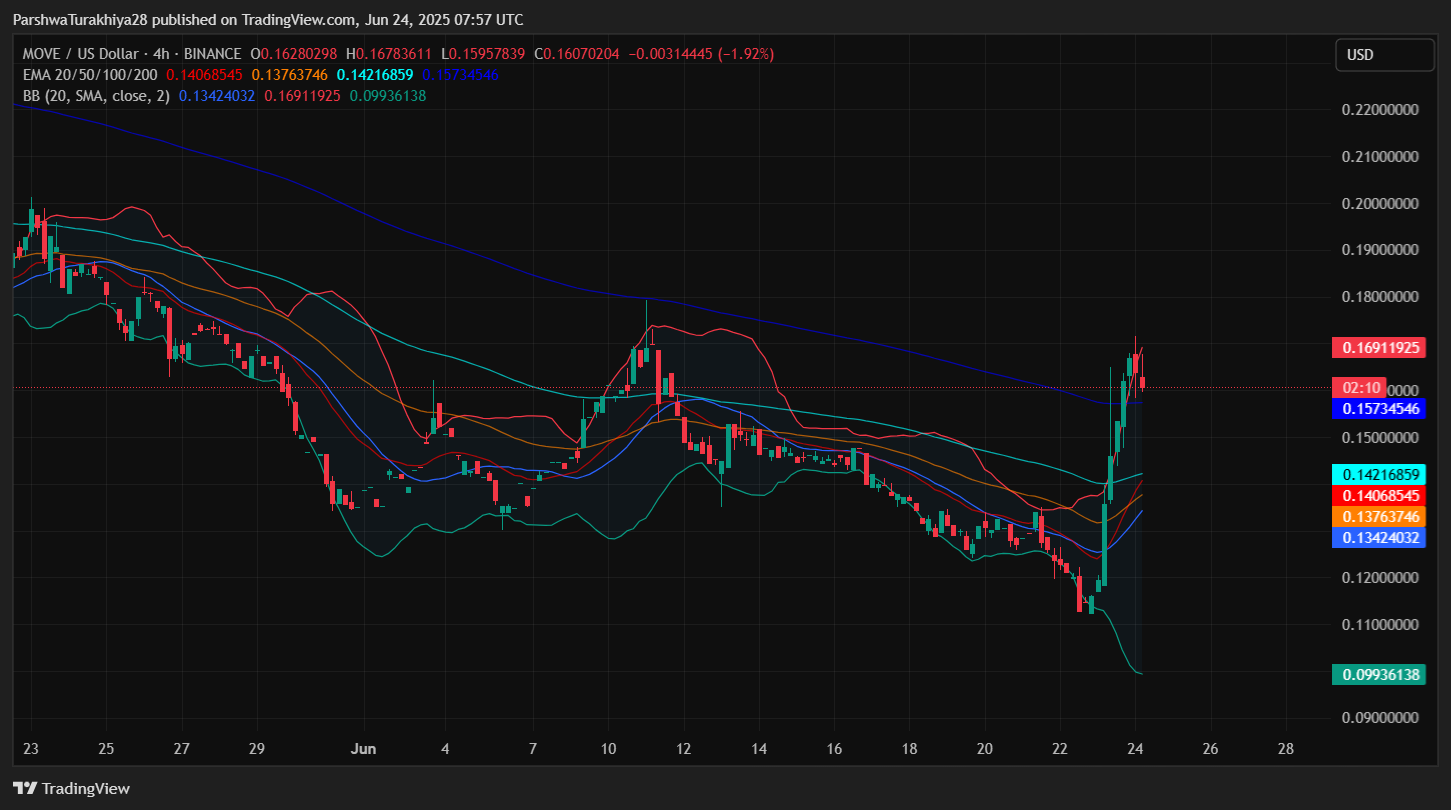
The Bollinger Bands confirm this as price has moved outside and now pulled back into the upper half, showing volatility compression.
Why Movement (MOVE) Price Going Up Today?
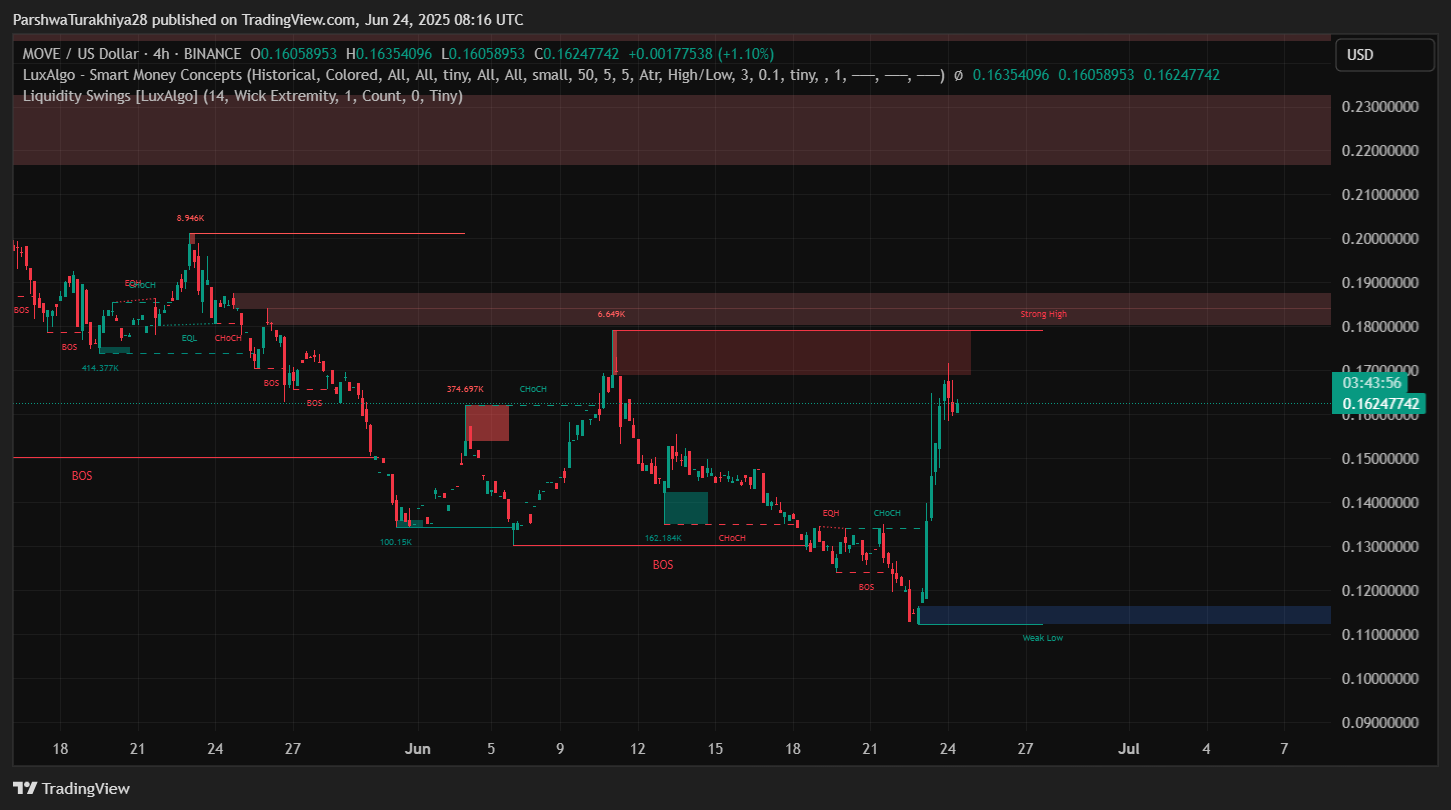
The answer to Why Movement (MOVE) price going up today lies in a combination of Smart Money structure shifts and breakouts through multi-week resistance. (SMC) reveals a break of structure (BOS) followed by a CHoCH reclaim, flipping previous bearish control zones.
This structure reclaim was further confirmed by a clean move through high-volume resistance at $0.149 and a sweep into an untested supply zone near $0.171. The liquidity sweep and bullish order block test at $0.124–$0.137 were key triggers that activated the move higher.
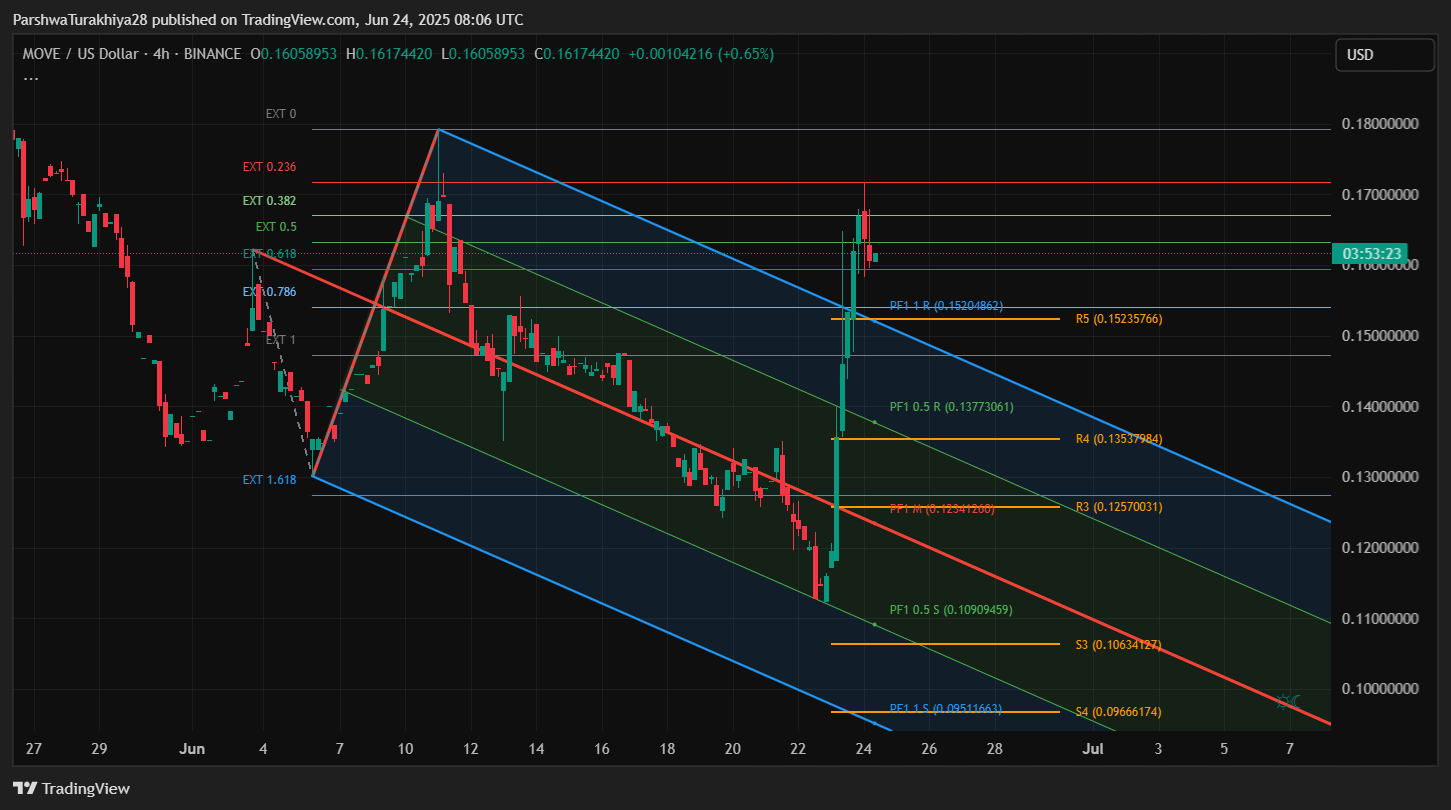
The move was also supported by a breakout from the descending pitchfork , which coincided with the Fib 0.618 level. MOVE is now approaching the R5 level at $0.1735, which also aligns with Smart Money supply, making it a critical resistance going forward.
Short-Term Outlook: Will MOVE Hold $0.152 Or Correct Deeper?
If Movement (MOVE) price breaks above $0.171 with volume, the next immediate target lies at $0.185 and then $0.205, where historical resistance from April aligns. However, if price continues to reject near current levels, a drop toward $0.152 (pivot and trend retest) remains likely.
Below that, $0.137 and $0.125 serve as major support zones, marked by the Fib midlines and prior liquidity breaks. Unless MOVE closes below $0.125, the bullish structure remains valid. Traders should monitor RSI/MACD on 1H and 4H for confirmation of momentum shift.
Movement (MOVE) Technical Forecast Table: June 25
| Indicator/Zone | Level (USD) | Signal/Comment |
| Movement (MOVE) price today | $0.1607 | Hovering near local high |
| Resistance 1 | $0.171 | Supply zone and upper band |
| Resistance 2 | $0.185 / $0.205 | Structural and historical |
| Support 1 | $0.152 | Trendline & Fib retest |
| Support 2 | $0.137 / $0.125 | Strong base and OB zone |
| RSI (30-min) | 51.93 (diverging) | Neutral but bearish divergence |
| MACD (30-min) | Near zero | Flattening after crossover |
| TSI (4H) | 0.92 | Extremely elevated |
| Chande Momentum (4H) | 78.9 | Overstretched zone |
| Donchian Channel (30-min) | Upper limit hit | Range top likely |
The Movement (MOVE) price update shows a strong breakout structure but cooling momentum across short-term indicators. Bulls must defend $0.152–$0.137 to maintain control, while a push above $0.171 could trigger another round of price expansion toward $0.185 and $0.205. Watch RSI divergence and MACD closely for the next directional cue.
Disclaimer: The information presented in this article is for informational and educational purposes only. The article does not constitute financial advice or advice of any kind. Coin Edition is not responsible for any losses incurred as a result of the utilization of content, products, or services mentioned. Readers are advised to exercise caution before taking any action related to the company.


