


- NEO market shows a bullish bounce, but price correction is possible due to weak ATR.
- The positive trend is being supported by buying pressure, but caution is advised as MFI approaches the overbought zone.
- Bullish momentum is fading, users must watch for trend reversal signals like a break below the 50-day MA.
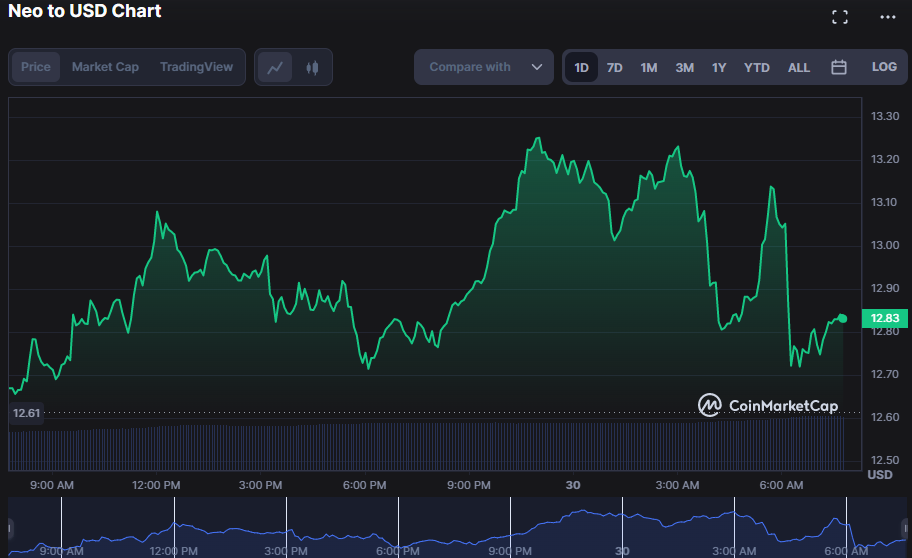
The Neo (NEO) market has had a bullish bounce in the previous 24 hours, with the price going from a low of $12.56 to a high of $13.26. At publication, a 1.79% increase had been made to $12.84 due to the bulls’ persistent optimism.
If bulls can sustain a break over $13.26, they may see more resistance at $14.00 and $15.00, which might see increased buying interest from traders. If, however, the bears succeed in driving the price below the $12.00 support level, this might set off a sell-off and initiate a negative trend in the near future.
During the upswing, the market capitalization and 24-hour trading volume rose to $906,166,152, an increase of 1.58% and 39.56%, respectively. Should market conditions continue steady and favorable, this upswing indicates a positive trend in which further growth is possible soon.
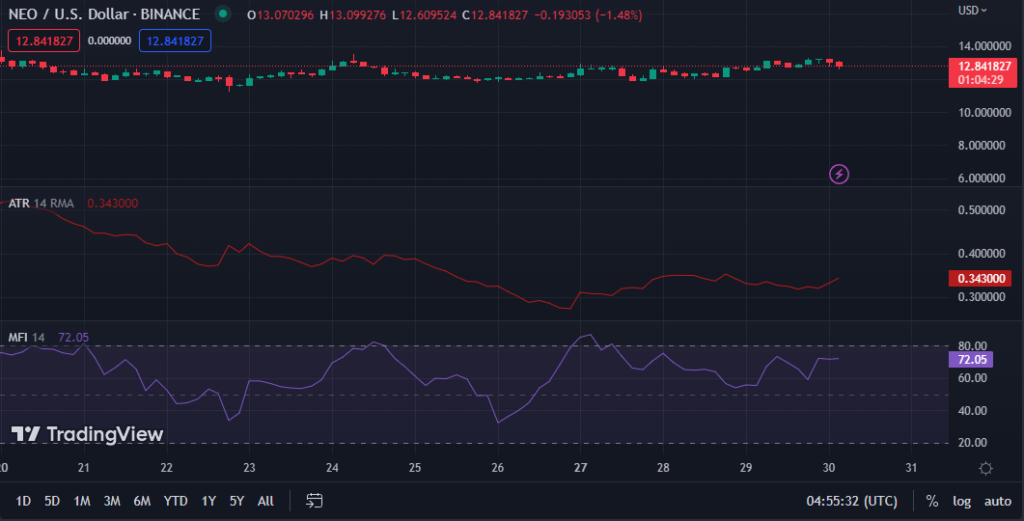
The Average True Range reading on the 3-hour price chart is 0.343000, indicating that the bullish power in the NEO market is rather weak and that a price correction is possible in the near future.
This assumption is made because the ATR gauges asset volatility, and a low reading indicates that the market is not experiencing large price movements.
The Money Flow Index value of 72.09 indicates that the positive trend in the asset’s price is supported by substantial buying pressure, implying that the price is likely to grow further in the near future. Yet, its proximity to an overbought condition signals that caution should be exercised as the price may soon face a pullback or consolidation.
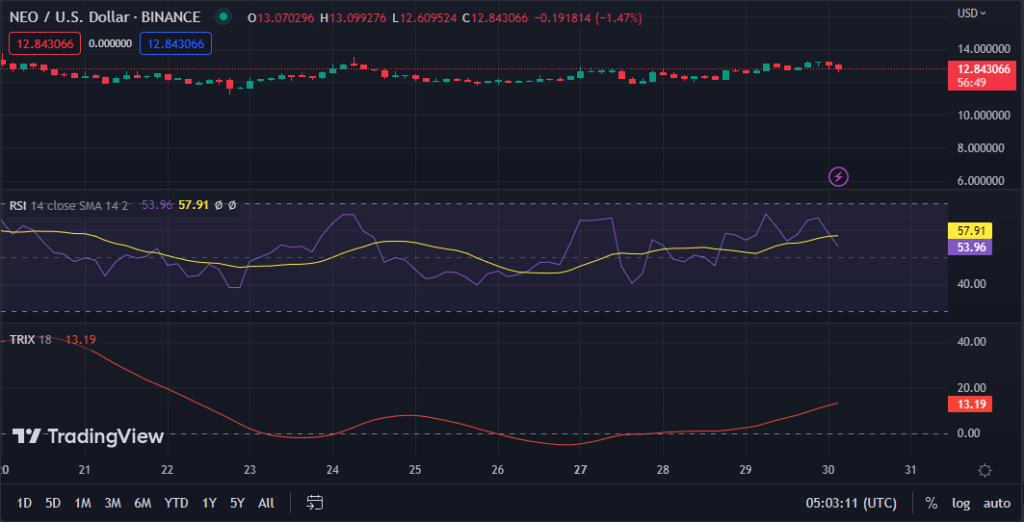
The RSI value of 53.94 and recent movement below its signal line on the NEO/USD price chart indicate that the bullish momentum is fading. However, the price is still above the 50-day moving average, indicating that there is still some support for the uptrend.
This move warns traders to be prudent and keep a close eye on the price for any potential trend reversal signals, such as a break below the 50-day moving average or a decrease in the RSI below 50.
With a TRIX score of 13.19, the bulls’ influence in NEO remains rather strong, and the price may rise further in the short term, but traders should be prepared for a potential drop if the TRIX score begins to fall.
This action increases investor trust in the NEO market and signals a positive mood, which may attract additional investors and further drive up the price.
In conclusion, while NEO’s bullish momentum is supported by buying pressure, caution is advised as weak volatility and fading momentum may lead to a potential price correction.
Disclaimer: The views, opinions, and information shared in this price prediction are published in good faith. Readers must do their research and due diligence. Any action taken by the reader is strictly at their own risk. Coin Edition and its affiliates will not be liable for direct or indirect damage or loss.
Disclaimer: The information presented in this article is for informational and educational purposes only. The article does not constitute financial advice or advice of any kind. Coin Edition is not responsible for any losses incurred as a result of the utilization of content, products, or services mentioned. Readers are advised to exercise caution before taking any action related to the company.
 Price Prediction 2026-2030: Will TRX Hit $0.50 Soon?")
 Price Prediction 2026-2050: Will HYPE Hit $100 Soon?")


: What Happens If You Use an Unlicensed Platform?")