
- BTC is preparing for the next movement after a 5-day consolidation.
- On the Bitcoin chart, multiple time frames indicate signs of bullish divergence.
- Double bottom formation and the Stochastic RSI show signs of a breakout.
Bitcoin is preparing for another move after consolidating between $25,538 and $26,182 for the last 5 days. It seems BTC bulls want to protect the $25,500 support level and in no time, break the $26,200 resistance zone.
Market analysis Youtuber CryptoRover suggests Bitcoin has experienced weeks of low volatility. According to him, past performance has proved that sharp price movements come after periods of low volatility. For this reason, the recent price stability this week might be a precursor for a significant market shift. Furthermore, BTC/USD has formed an ascending triangle pattern, which could confirm the direction of the market shift.
The analyst urged traders to watch for a breakout above the downward-sloping resistance line. According to him, this breakout will take place within the next 12 – 13 hours. On the contrary, Bitcoin price action could break above the upward-sloping support line and trigger a short-term period of high market volatility.
If BTC bulls can break to the upside, the price action could test the $26,300 target and settle for a while above the present overhead resistance. Conversely, a downside might trigger the next drop from $25,735 to $25,200 and therefore test a new low in the market.
However, the Bitcoin chart is showing promising signs of an upcoming bullish divergence across multiple timeframes including the 3-day, 24 and 12-hour time frames. For this reason, CryptoRover is convinced that Bitcoin could record positive price momentum in the near future. According to the analyst, the double bottom scenario and the stochastic RSI are some of the technical indicators reinforcing his Bitcoin forecast.
The analysis suggests BTC retested the $25,000 key support level, which served as resistance in the previous bear market. BTC/USD has remained within this level for an extended period of time, and if this continues, the pattern could culminate into a double-bottom pattern. Historically, double-bottom patterns have often been a technical indicator of an upcoming bullish reversal.
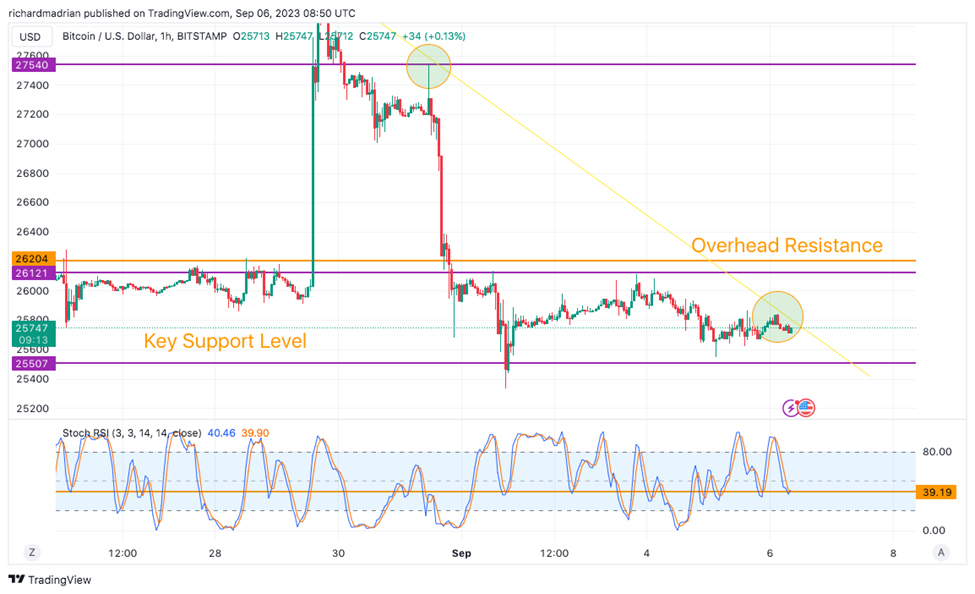
In addition, Bitcoin price action is trading within oversold conditions as per the Stochastic RSI indicator. However, the stochastic RSI is on the verge of marking a bullish crossover on the BTC chart. In the past, this indicator has served as a reliable buy signal. The last time the stochastic RSI marked a bullish crossover, BTC rallied from $24,800 to $30,000.
Disclaimer: The views and opinions, as well as all the information shared in this price analysis, are published in good faith. Readers must do their own research and due diligence. Any action taken by the reader is strictly at their own risk. Coin Edition and its affiliates will not be held liable for any direct or indirect damage or loss.
Disclaimer: The information presented in this article is for informational and educational purposes only. The article does not constitute financial advice or advice of any kind. Coin Edition is not responsible for any losses incurred as a result of the utilization of content, products, or services mentioned. Readers are advised to exercise caution before taking any action related to the company.


 Price Prediction: UNI Eyes $5 as UNI Extends Bullish Breakout")
