


- Whale Alert recently tweeted that 500,000,000 XRP was unlocked from an unknown escrow wallet.
- The post shared that the estimated dollar value of the token amount is around $234,797,873.
- In related news, technicals on XRP’s daily chart recently flagged bearish.
The crypto whale tracking page Whale Alert tweeted this morning that a large amount of Ripple (XRP) has been unlocked from escrow at an unknown wallet. According to the tweet, 500,000,000 XRP was unlocked, which is estimated to be worth around $234,797,873.
At press time, CoinMarketCap shows that XRP’s price printed a loss over the last 24 hours. Currently, XRP is changing hands at $0.4648, which is a 2.53% drop in price in the past day. This negative 24-hour performance has chipped away at XRP’s weekly price performance. Nevertheless, XRP’s weekly price performance remains in the green at +0.21%.
XRP dropped 0.43% against the market leader Bitcoin (BTC) as well in the last 24 hours. Fortunately, the remittance token was able to outperform the leading altcoin Ethereum (ETH) by 0.28% during this period.
The altcoin may print a new 24-hour low in today’s session given that XRP’s price is trading closer to its daily low of $0.4618 than it is to its 24-hour high of $0.4818. The 56.37% increase in XRP’s daily trading volume, however, may be a sign of bulls trying to prevent the altcoin’s price from setting a new low for today.
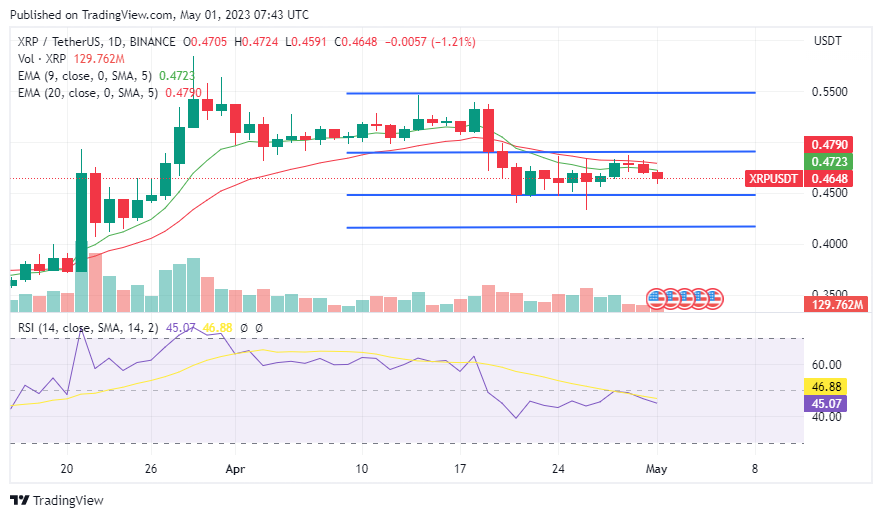
Daily chart for XRP/USDT (Source: TradingView)
Currently, XRP’s price is trading within the narrow channel between $0.4478 and $0.4911. Furthermore, the altcoin’s price has dropped below the 9-day and 20-day EMA lines in the last 3 days, where it continues to trade at press time.
Technical indicators on XRP’s daily chart are flagging bearish as well, which suggests that the crypto’s price will continue to fall in the next 24-48 hours. The daily RSI line has recently crossed bearishly below the daily RSI SMA line. Furthermore, the 9-day EMA line is trading bearishly below the 20-day EMA line.
Disclaimer: The views and opinions, as well as all the information shared in this price analysis, are published in good faith. Readers must do their own research and due diligence. Any action taken by the reader is strictly at their own risk. Coin Edition and its affiliates will not be held liable for any direct or indirect damage or loss.
Disclaimer: The information presented in this article is for informational and educational purposes only. The article does not constitute financial advice or advice of any kind. Coin Edition is not responsible for any losses incurred as a result of the utilization of content, products, or services mentioned. Readers are advised to exercise caution before taking any action related to the company.


