


- Bulls counteract GMT’s bearish trend and drive prices up to $0.4894.
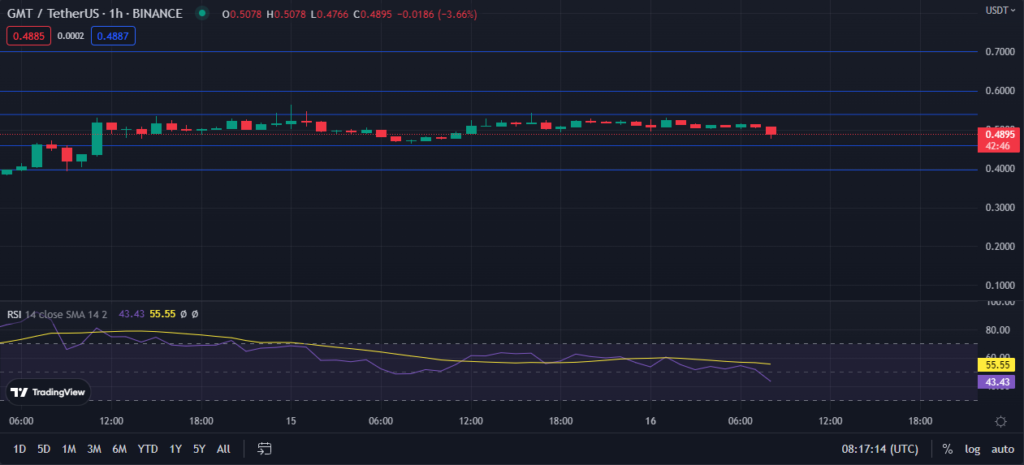
- Traders are warned to be on the lookout for a reversal by technical indicators.
- GMT price oscillates between $0.4664 and $0.5388 as support and resistance levels.
Major digital currencies like Bitcoin and Ethereum have reached monthly highs, trading above $20,500 and $1,500 respectively, thanks to a strong market sentiment that has seen their prices rise by over 20% in seven days.
In accordance with this positive sentiment, bulls flooded the STEPN (GMT) market after a period of a bearish trend, canceling off the market’s previous downward momentum. This bullish reaction sent the GMT price up 4.20% to $0.4887 as of press time.
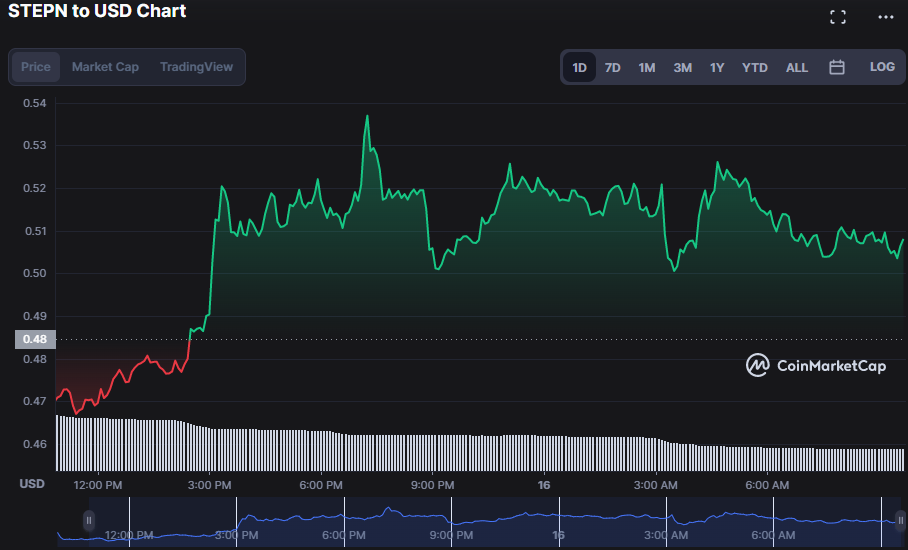
The bullish surge was successful in keeping the GMT price fluctuating between $0.4664 and $0.5388. If the positive trend holds, investors may anticipate the GMT price to rise over its present resistance level, with a possible objective of $0.60.
A break over $0.60 will signal the start of a bullish rally toward the next resistance level, which is around $0.70. However, if the bulls’ run ends and the GMT price falls below its support level of $0.4664, investors should brace themselves for a further slide into the $0.40 level, which may be disastrous for GMT prices in the long run.
The GMT market’s RSI is currently at 43.20, trending south and below the signal line, suggesting a potential negative swing in the near future. If the RSI is moving in this direction, it means that buying pressure is fading and the market is trending toward selling opportunities.
The trend of the short-term MA below the long-term MA is also a warning sign for traders that a bear run may be imminent. This is supported by the values of the 5-day moving average (0.5061) and the 20-day moving average (0.5124). With the short-term moving average now below the long-term moving average, traders may be rushing to take gains, increasing the risk of a bear run.
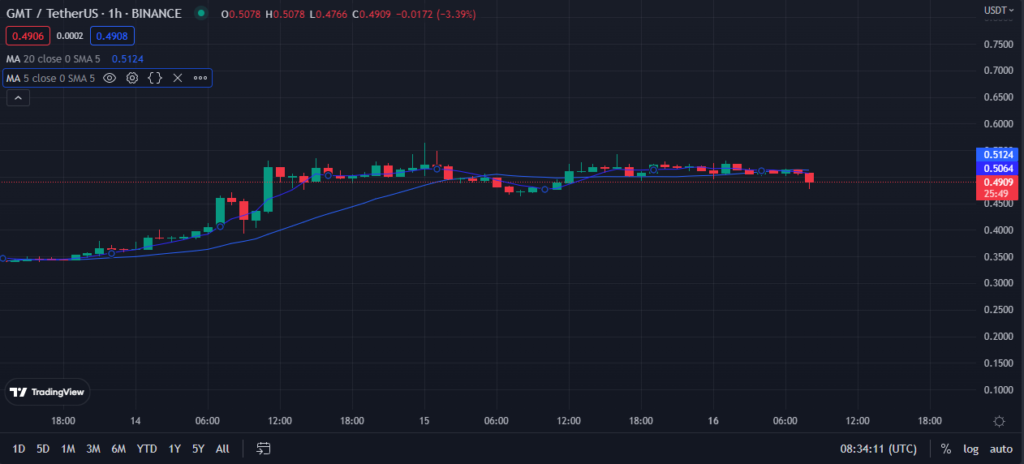
A closer look at the GMT price chart reveals that bullish momentum is fading, despite the market’s current upward path.
Disclaimer: The views and opinions, as well as all the information shared in this price analysis, are published in good faith. Readers must do their own research and due diligence. Any action taken by the reader is strictly at their own risk, Coin Edition and its affiliates will not be held liable for any direct or indirect damage or loss.
Disclaimer: The information presented in this article is for informational and educational purposes only. The article does not constitute financial advice or advice of any kind. Coin Edition is not responsible for any losses incurred as a result of the utilization of content, products, or services mentioned. Readers are advised to exercise caution before taking any action related to the company.
: What Happens If You Use an Unlicensed Platform?")


