


 Price Nosedives to 7-day Low; Will the Support Hold?")
- CAKE faces bearish pressure potential support level breach.
- A bullish rally above the $3.87 resistance could yield significant returns.
- Stochastic RSI indicates the possibility of a positive reversal in the near future.
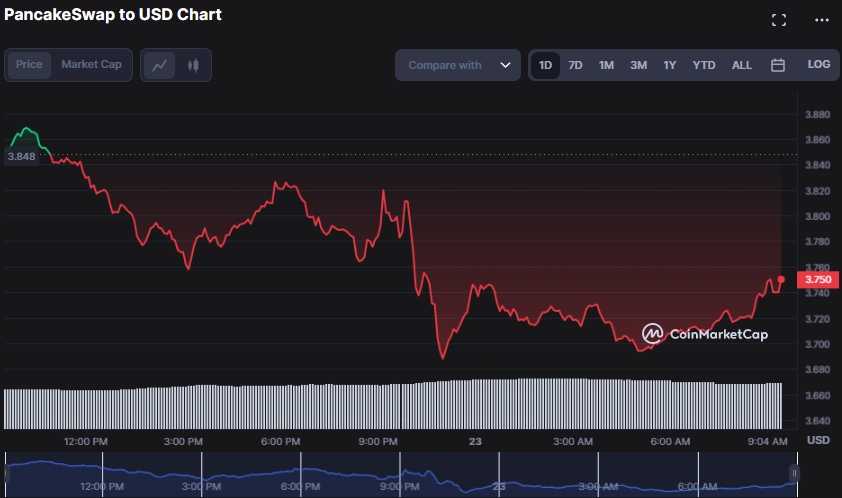
Bullishness in the PancakeSwap (CAKE) market has ceased after bulls failed to breach the 24-hour high of $3.87. This retreatment resulted in a significant decline in the CAKE price, which sank to its 7-day low of $3.68 in only a few hours. At press time, CAKE was priced at $3.74, down 2.57% from the previous day’s close.
Continuing bear domination may shatter the support level at $3.68, triggering more selling pressure between $3.50 and $3.30. Owing to this anxiety, the market capitalization dropped by 2.73% to $684,673,513, indicating that investors are cautious and taking profits while waiting for a clear indication of a trend reversal or a new support level.
But, if bulls rally and break the $3.87 resistance level, the next resistance levels may be around $4.20 and $4.50. This move has the potential to yield large returns for those who can capitalize on the positive momentum. The 24-hour trading volume increased by 17.88% to $46,503,139, indicating that traders are actively buying and selling CAKE, which might push its price in the near term.
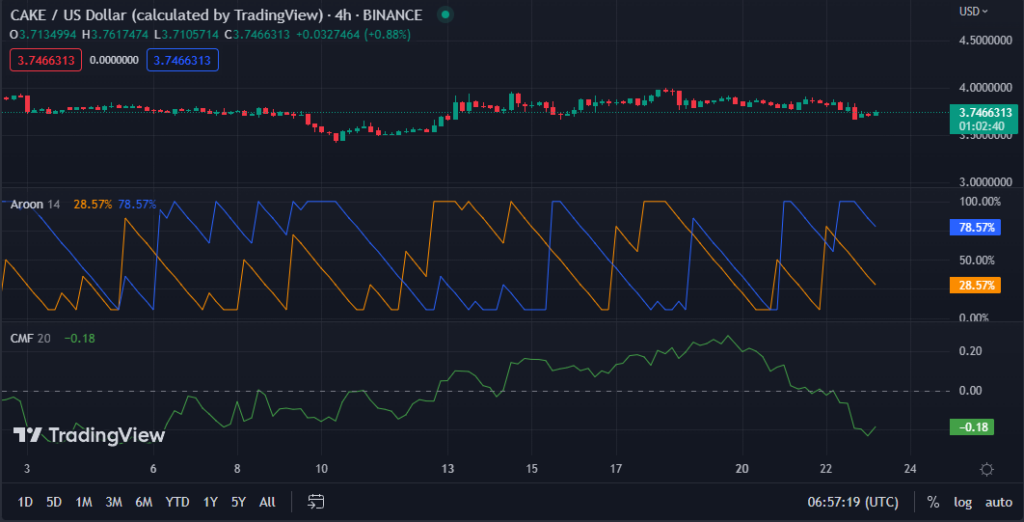
In the 4-hour price chart, the Aroon down advances above the Aroon up, indicating the bear’s dominance and power in the CAKE market, with the former reading 78.57% and the latter 28.57%, respectively.
This movement indicates that CAKE is now in a significant downtrend, indicating that selling pressure exceeds buying pressure. Because of this trend, traders may consider shorting CAKE or waiting for a possible reversal before establishing long positions.
With a score of -0.18, the Chaikin Money Flow is in negative territory, indicating that capital outflow is greater than capital inflow, which might signal a pessimistic attitude in the market for CAKE.
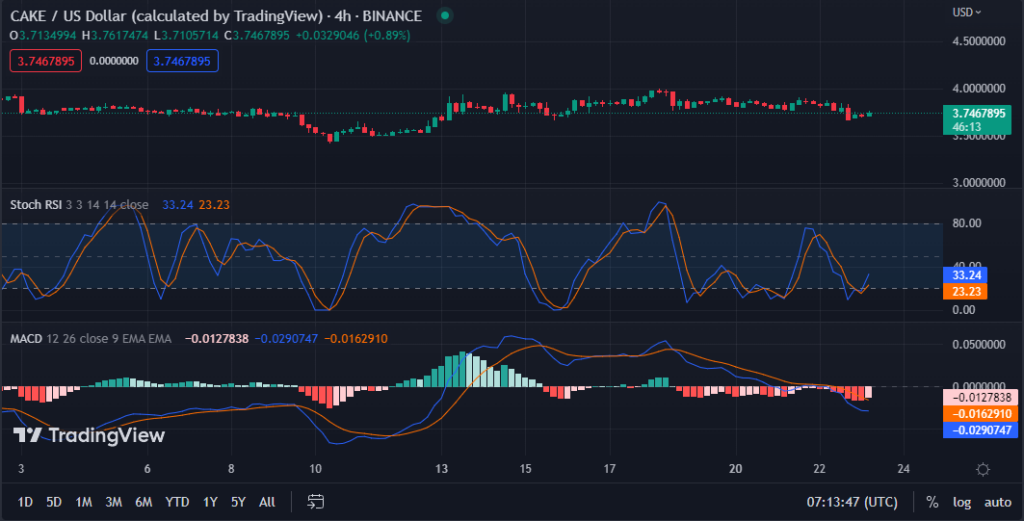
In the CAKE price chart, the MACD line goes below the signal line, indicating a negative trend in the near term. Consequently, traders may consider selling holdings or putting stop-loss orders in place to minimize future losses.
With a value of -0.0291471, the MACD trend is negative, and the histogram produces red bars below the signal line, indicating the intensity of the bearish trend.
However, the stochastic RSI reading of 34.20 and movement above its signal line show that a positive reversal is possible in the near future. This optimism stems from the stochastic RSI moving out of the oversold level, indicating that selling pressure may relax and buyers may enter the market, perhaps leading to a price gain.
CAKE faces bearish pressure, but a positive reversal may be on the horizon with the stochastic RSI’s movement out of the oversold territory.
Disclaimer: The views, opinions, and information shared in this price prediction are published in good faith. Readers must do their research and due diligence. Any action taken by the reader is strictly at their own risk. Coin Edition and its affiliates will not be liable for direct or indirect damage or loss.
Disclaimer: The information presented in this article is for informational and educational purposes only. The article does not constitute financial advice or advice of any kind. Coin Edition is not responsible for any losses incurred as a result of the utilization of content, products, or services mentioned. Readers are advised to exercise caution before taking any action related to the company.
 Price Prediction 2026, 2027, 2028, 2029, 2030-2050")


