


 Bulls Recover: Will the Positive Sentiment Persist?")
- PEPE’s bullish momentum persists with strong MACD support.
- Caution prevails as trading volume dips with potential consolidation ahead.
- Overbought conditions suggest short-term profit-taking possibilities.
Bearish momentum has been in control of the Pepe (PEPE) market from the start of the day until bulls secured support at the intraday low of $0.0000007872. As a consequence, the price of Pepe started to recover, indicating a possible positive turnaround. This level of support spurred increased purchasing activity, resulting in increased trading volume and a steady rise in market price.
As a result, PEPE jumped to a 24-hour high of $0.0000008135 before encountering some selling pressure. PEPE was trading at $0.0000008135 at press time, up 3% from the previous day’s low. The positive trend and increased market capitalization by 1.24% to $315.82 million indicate investors are enthusiastic about PEPE’s prospects.
In contrast, 24-hour trading volume fell by 22.74 % to 37.36 million, indicating likely hesitancy or caution among investors. This drop in trading volume is likely attributable to profit-taking or a brief slowdown in market activity.

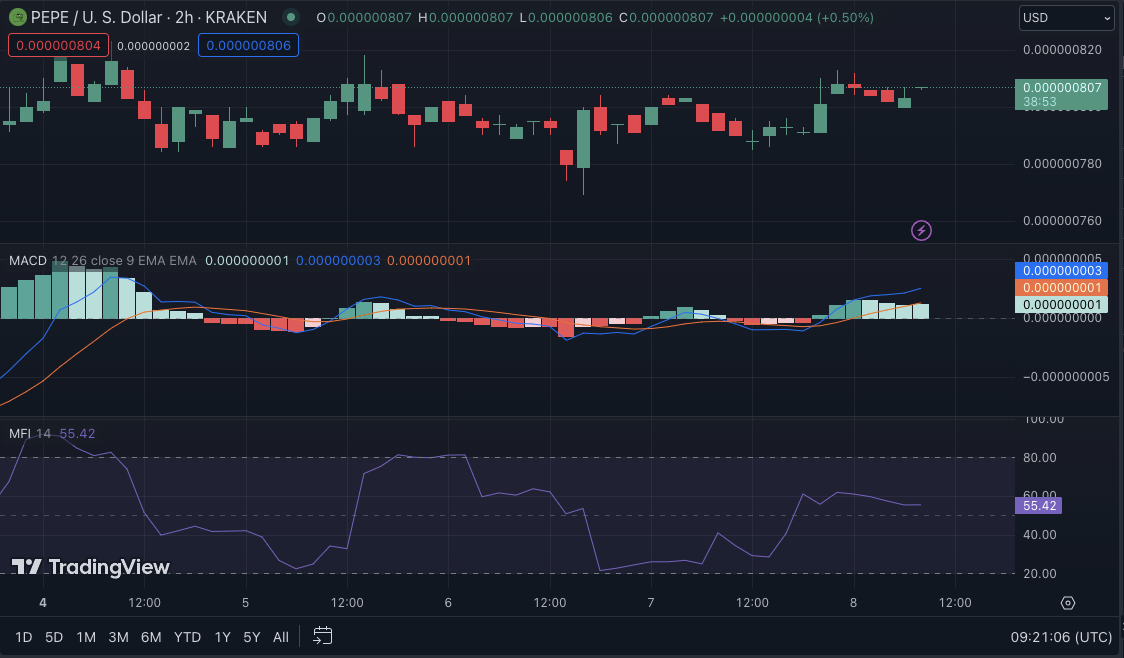
The MACD blue line is still in positive territory, with a value of 0.000000003, indicating that the bullish momentum is strong. Furthermore, the histogram is rising, indicating that purchasing pressure is intensifying. This pattern shows that the bulls remain in control of the market and that additional gains are possible.
In contrast, the Money Flow Index rating of 55.72 points lower indicates that some selling pressure is developing. This pattern might lead to a brief market pullback or consolidation before the bullish momentum continues.
If the MFI goes below 50, it might suggest an adverse change in market sentiment. However, a continuation of higher highs in the histogram indicates that the bullish trend will continue.
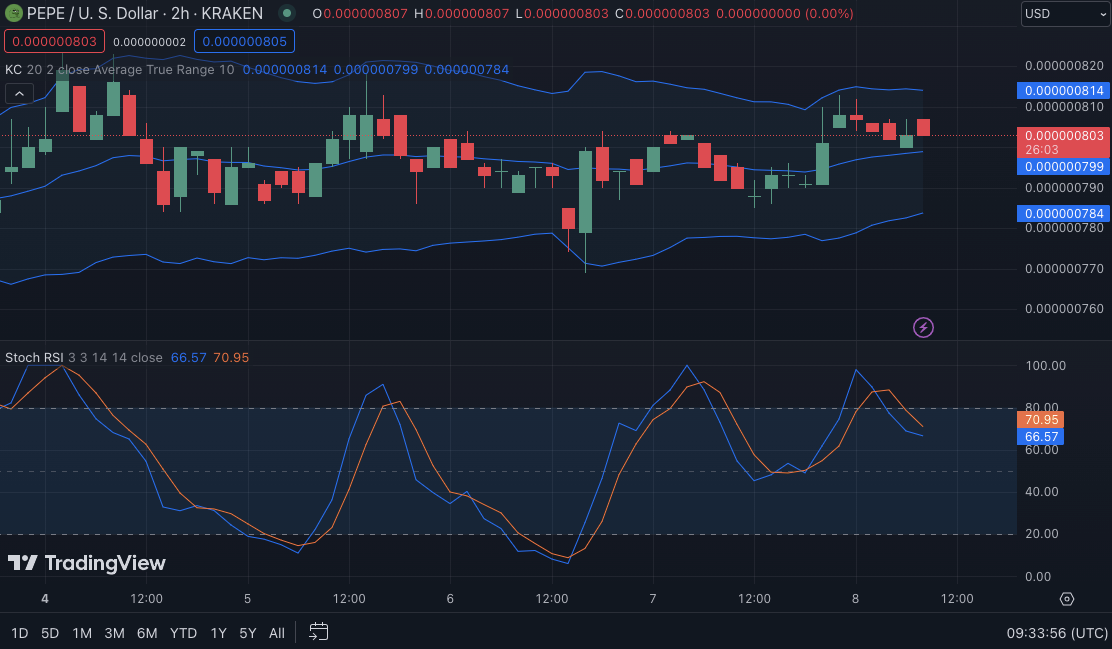
The stochastic RSI score of 73.55 indicates that the market is overbought. This trend may result in a short-term decline or profit-taking by traders. If the stochastic RSI continues above 70, the positive momentum is still strong, and the market may continue to rise. Consequently, a slip below its signal line could signal a shift in momentum and a potential reversal to bearishness.
On the PEPE price chart, the Keltner Channel bands show a tight trading range, with the top band at 0.000000814, the middle bar at 0.000000799, and the bottom at 0.000000784. However, the upward movement of the bands shows that the market can break out of this range and continue its upward trajectory. Moreover, the price action motion above the middle bar indicates that buyers are in command and may drive the market higher.
In conclusion, Pepe (PEPE) shows signs of bullish strength, but caution is advised as overbought conditions and potential profit-taking could lead to short-term fluctuations.
Disclaimer: The views, opinions, and information shared in this price prediction are published in good faith. Readers must do their research and due diligence. Any action taken by the reader is strictly at their own risk. Coin Edition and its affiliates will not be liable for direct or indirect damage or loss.
Disclaimer: The information presented in this article is for informational and educational purposes only. The article does not constitute financial advice or advice of any kind. Coin Edition is not responsible for any losses incurred as a result of the utilization of content, products, or services mentioned. Readers are advised to exercise caution before taking any action related to the company.
: What Happens If You Use an Unlicensed Platform?")


