


- PEPE registers lower highs after hitting a maximum price of $ 0.000001863 on the second day.
- Simple Moving Average gives PEPE a run for its money, as resistance piles.
- A breakout from the bearish flag seems out of the equation; PEPE may test the lower trend line again.
PEPE Coin has been on a roll for the last seven days after opening the trade for the week at $0.000001535. On the second day of the past week, it reached a maximum value of $0.000001863. Shortly after reaching its maximum price, PEPE started to make lower highs until the fifth day. Since the fifth day onwards, PEPE has been consolidating between $0.0000015 and $0.0000016.
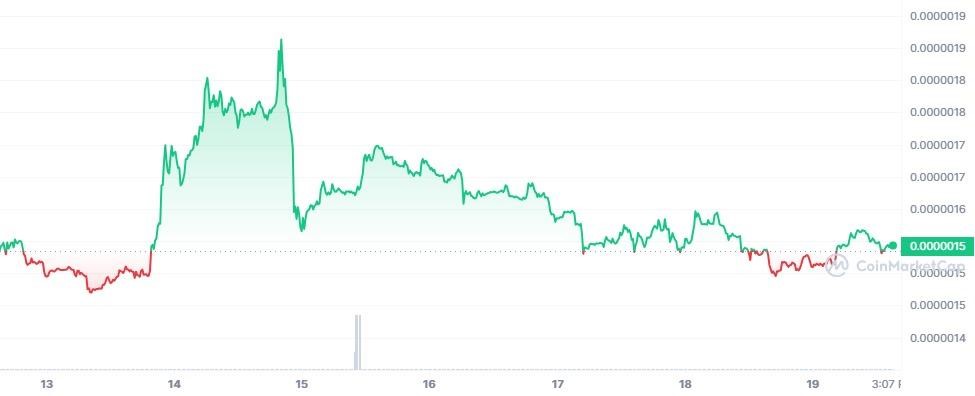
At press time, PEPE price is exchanging hands at $0.000001543 with an increase of 0.38% within the last 24 hours. Moreover, the trading volume of PEPE decreased by 7.62% to $84,760,078. This could be because the traders are leaving the market.
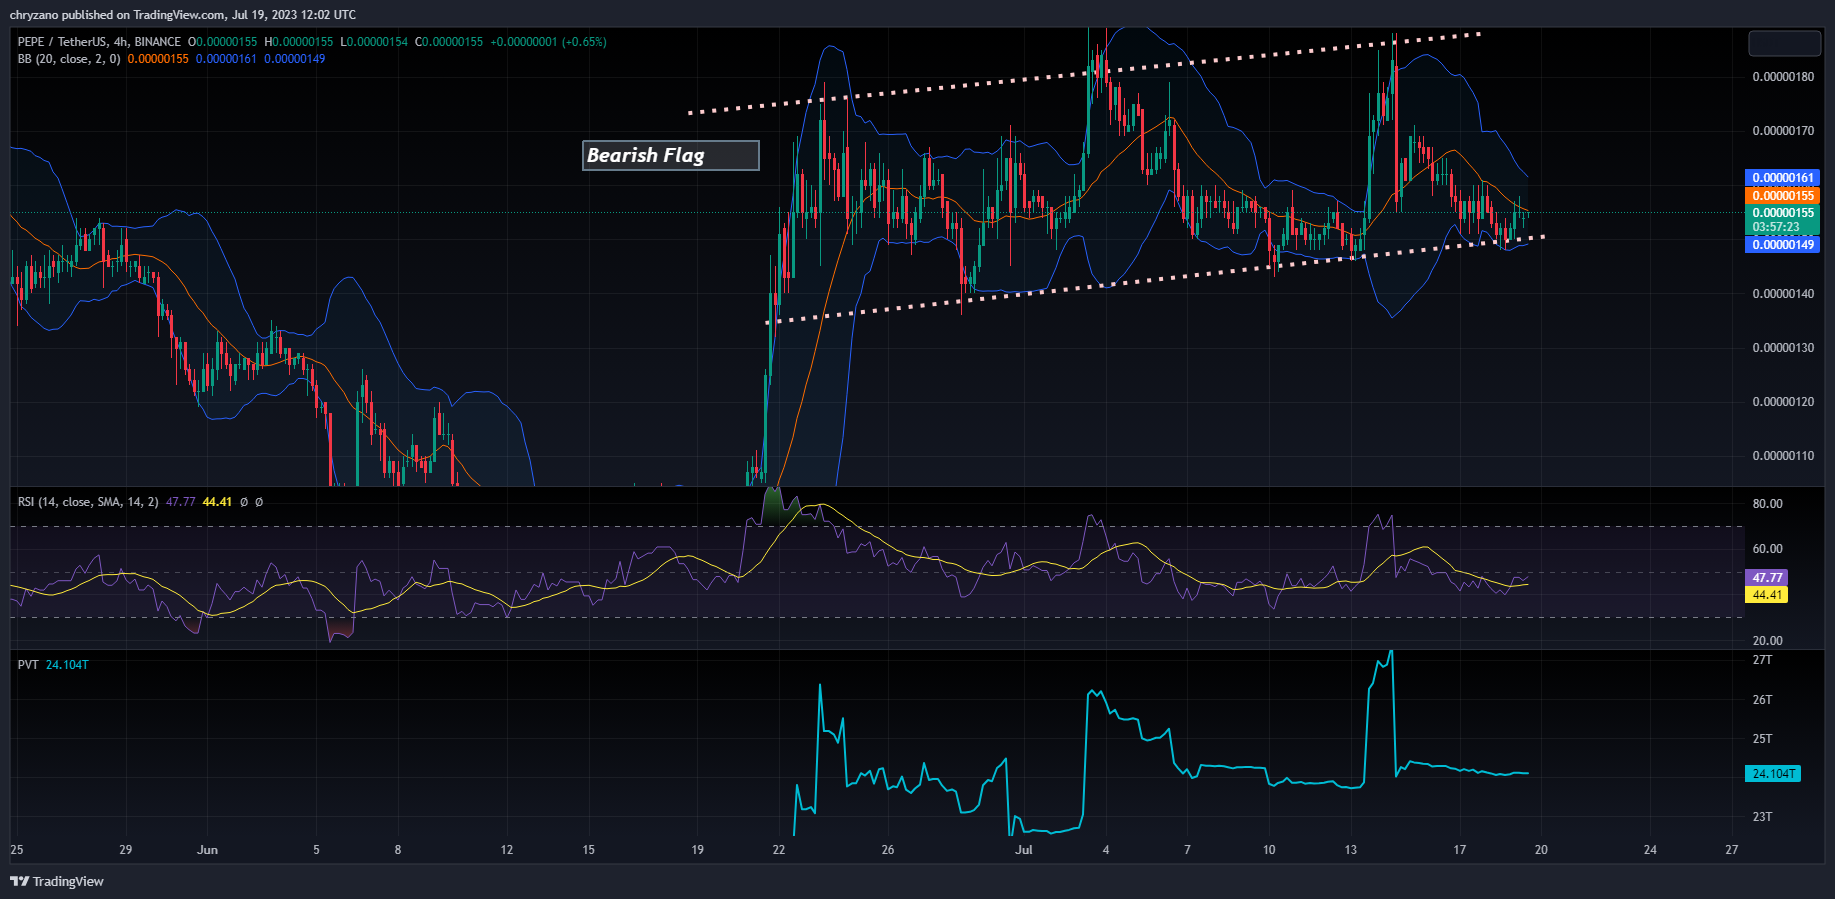
The above chart shows how PEPE touched the upper and lower trendlines of the bearish flag thrice. As PEPE is currently rebounding off of the lower trendline we could expect it to rise higher. However, there seems to be some resistance encountered near the Simple Moving Average of the Bollinger bands. As such, there is a possibility that PEPE could reverse and seek support from the lower trend line of the bearish flag, as at previous times.
Since the Bollinger Bands are squeezing there seems to be less volatility whereby any price action could be marginal. Moreover, the Relative Strength Index (RSI) reads a value of 47.77 and the RSI line seems to be tiling upwards. As such, PEPE is on a strong trend. If PEPE manages to break the SMA it may reach $0.00000187.
When considering the breakout of PEPE from the flag, the present kissing of the lower trendline doesn’t seem to be a breakout point. The aforementioned notion could be established by looking at the Volume Price Trend indicator (VPT) which reads a value of 24.104T. The VPT of PEPE was revolving around the same reading as the present value, on every occasion PEPE touched the lower trend line. As such this could be just another intersection point.
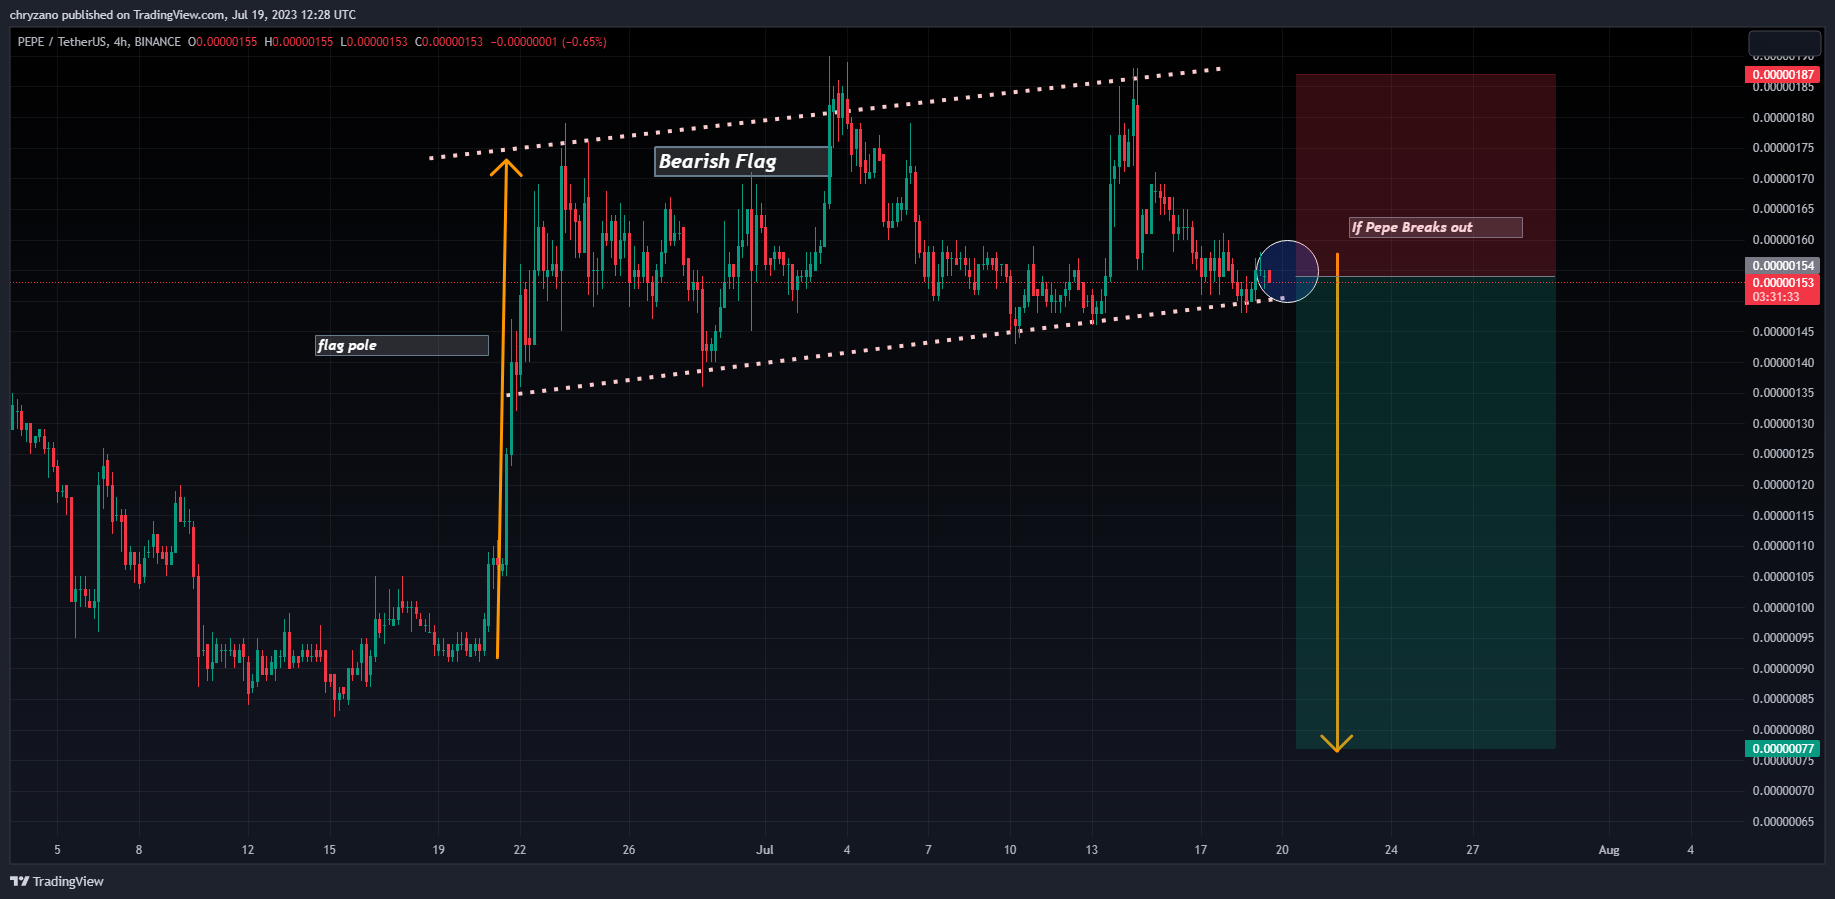
However, if PEPE goes against the market and breaks out from the bearish flag, it could fall. If the preceding happens, sellers may need to spring into action. As per the best practice of trading the bearish flag, sellers may want to have their entry point just below the breakout point and set their take profit at the transposition length of the flag pole as shown above. If PEPE falls it may seek support at $0.0000009.
Disclaimer: The views, opinions, and information shared in this price prediction are published in good faith. Readers must do their research and due diligence. Any action taken by the reader is strictly at their own risk. Coin Edition and its affiliates will not be liable for direct or indirect damage or loss.
Disclaimer: The information presented in this article is for informational and educational purposes only. The article does not constitute financial advice or advice of any kind. Coin Edition is not responsible for any losses incurred as a result of the utilization of content, products, or services mentioned. Readers are advised to exercise caution before taking any action related to the company.


