


 Soars to 7-Day High: Is the Bull Run Over?")
- PEPE price surges to new 7-day high as bullish optimism prevails.
- Increased trading volume fuels PEPE market activity and liquidity.
- Indicators suggest a potential price upswing if bullish power strengthens.
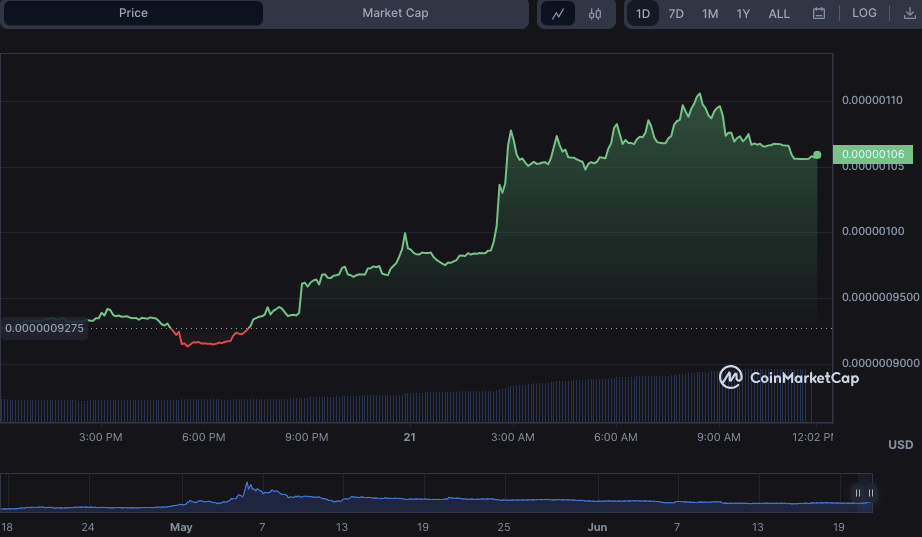
Bullish optimism in the Pepe (PEPE) market has peaked in the past 24 hours, with bulls driving the price from an intraday low of $0.000000912 to a new 7-day high of $0.000001106. As of press time, the price had slightly retraced to $0.000001059, reflecting a 14.19% rise from its intraday low.
Along with the price rise, the market capitalization of PEPE increased 14.19%, hitting $414,074,178. Furthermore, the trading volume increased by 130.42%, striking $197,659,402.
This increase in trading volume shows more activity and liquidity in the PEPE market as more investors buy and sell PEPE tokens.
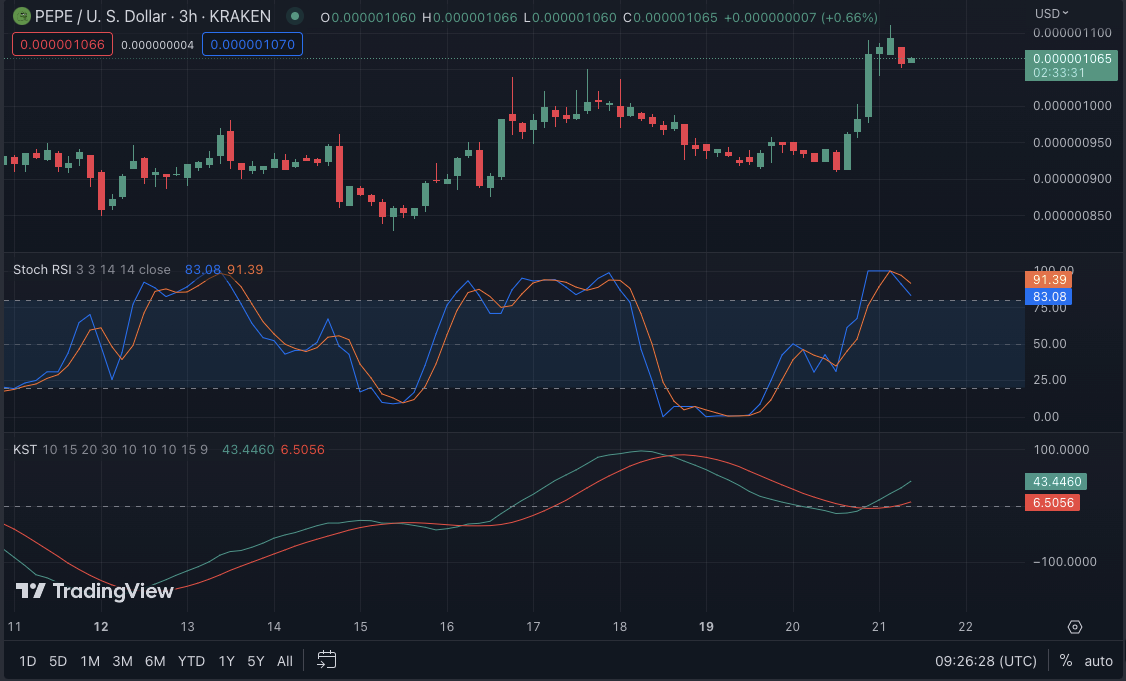
With the stochastic RSI at 83.21 and heading below its signal line, the bullish momentum in the PEPE market may be losing steam. This level indicates a probable market trend reversal, as investors may begin taking gains and selling off their holdings.
On the other hand, the Know Sure Thing (KST) indicator value of 43.4460 shows that the market may still have some opportunity for growth. This bullish anticipation is because the KST identifies long-term trends and potential reversals, and a reading above 0 indicates that the market still has some positive momentum and may continue to rise.
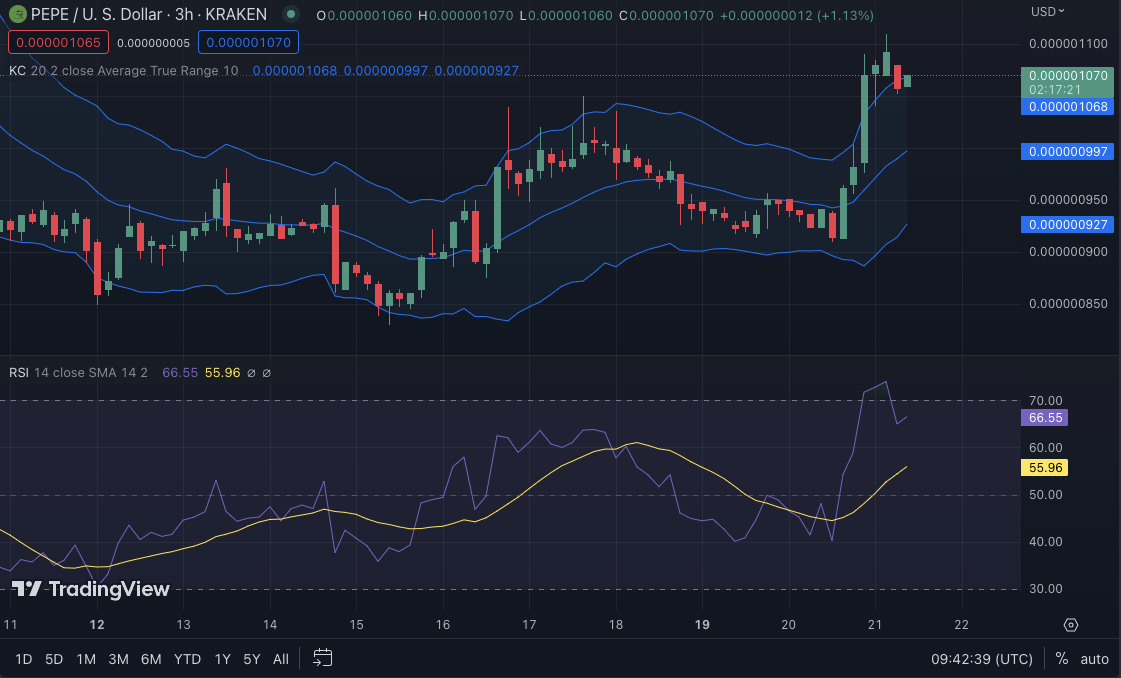
The Keltner Channel bands on the PEPE/USD price chart are rising, with the top, middle, and lower bands reaching $0.000001066, $0.000000997, and $0.000000927, respectively.
When the Keltner Channel bands move higher, it signals that market volatility is increasing and that an upward trend may be emerging. The broadening of the bands indicates that price swings are growing, signaling increased momentum.
The bullish momentum is strengthened further by the Relative Strength Index (RSI) value of 65.92. This RSI indicator is above 50, suggesting that buying pressure is more significant than selling pressure, signaling a probable positive trend.
In conclusion, despite slight hints of reversal, PEPE’s technical indicators signal promising market resilience and a possible continued uptrend.
Disclaimer: The views, opinions, and information shared in this price prediction are published in good faith. Readers must do their research and due diligence. Any action taken by the reader is strictly at their own risk. Coin Edition and its affiliates will not be liable for direct or indirect damage or loss.
Disclaimer: The information presented in this article is for informational and educational purposes only. The article does not constitute financial advice or advice of any kind. Coin Edition is not responsible for any losses incurred as a result of the utilization of content, products, or services mentioned. Readers are advised to exercise caution before taking any action related to the company.


 Price Prediction 2026, 2027, 2028, 2029, 2030 -2050")