


- PEPE faces bearish headwinds as it struggles to breach the $0.0000006958 barrier, with support at $0.0000006559.
- Short-term lag in PEPE’s price may give way to a bullish reversal, with potential resistance at $0.0000006550.
- Stochastic RSI hints at an undervalued PEPE, but MFI suggests lingering selling pressure in the market.
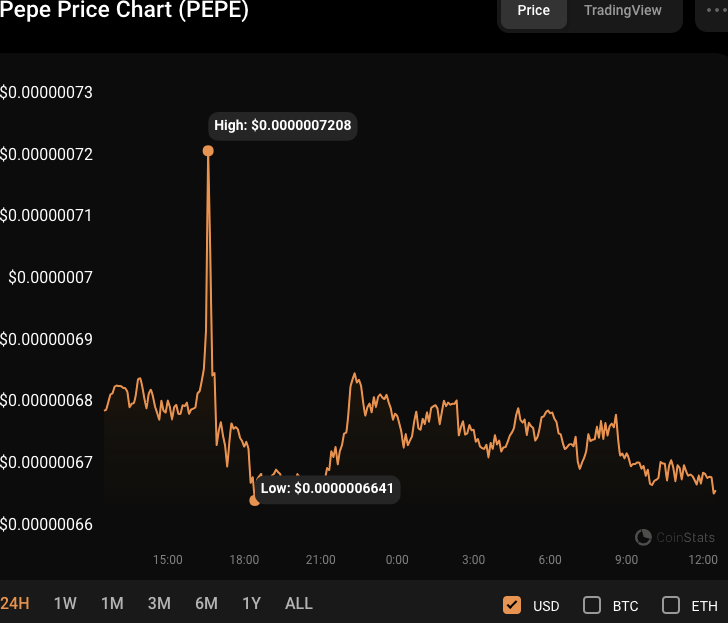
In the previous 24 hours, the Pepe (PEPE) market has suffered a significant pullback after bulls failed to break through the $0.0000006958 barrier. As a result, bears dragged the PEPE price down to an intra-day low of $0.0000006559 before establishing a modest comeback. However, negative momentum remained dominant at press time, with PEPE trading at $0.0000006666, a 1.76% drop from its 24-hour peak.
If the bearish trend continues and the $0.0000006559 support level is breached, the next level of support to look for is around $0.0000006450. This level has previously functioned as a solid support zone and may attract bargain-hunting buyers. However, if the selling pressure persists, there is a chance of an additional decline into the next support level at $0.0000006350.
During the recession, PEPE’s capitalization and 24-hour trading volume declined by 1.58% and 0.72%, respectively, to $261.33 million and $60.7 million. However, if bulls take control and purchase pressure builds, a return toward the $0.0000006550 resistance level is possible.
On the 4-hour price chart for PEPEUSD, the 100-day moving average (blue) with a rating of 0.000000694 rises above the 20-day moving average (yellow) with a rating of 0.000000664 indicating that the short-term pricing lags behind the long-term price.
However, a bullish crossing is possible soon, with the 20-day MA heading higher and the 100-day MA indicating probable convergence. This pattern may mean a change in momentum, leading to a break over the resistance level at $0.0000006550.
The stochastic RSI, with a value of 11.06, adds to the positive reversal potential. This pattern shows that PEPE is undervalued and due for an upward price correction. If the stochastic RSI rises and crosses over the oversold level, it might strengthen the bullish crossing situation and raise the chance of a breakthrough above the barrier level.
On the other hand, the Money Flow Index (MFI) rating of 42.37 and trending south shows that the PEPE market may still be under selling pressure. This selling pressure could stall the bullish turnaround and restrict the price correction to the upside.
If the MFI decreases and goes below the oversold level, it might imply more selling pressure and reduce the likelihood of a breakout.
In conclusion, PEPE faces a crucial challenge at the $0.0000006559 support level. While some indicators suggest a potential bullish reversal, selling pressure remains a concern.
Disclaimer: The information presented in this article is for informational and educational purposes only. The article does not constitute financial advice or advice of any kind. Coin Edition is not responsible for any losses incurred as a result of the utilization of content, products, or services mentioned. Readers are advised to exercise caution before taking any action related to the company.
 Price Prediction 2026, 2027, 2028, 2029, 2030-2050")


