


- PEPE soars with a 795% monthly gain, outpacing market trends.
- Bitcoin’s all-time high at $73K fuels PEPE’s 11% rebound from its daily low.
- Technical indicators hint at PEPE’s potential reversal, with RSI overbought.
Pepe (PEPE) has been bullish the previous week, with prices ranging between an intra-week high of $0.00000654 and a low of $0.00000976. This upward trend may be due to increased investor interest and optimism in the cryptocurrency market, which follows a Bitcoin bull run that has achieved new all-time highs multiple times in the last week.
However, in the previous 24 hours, PEPE bears have had the upper hand, with the price falling to a low of $0.00000761, testing support levels. This price correction could be due to short-term traders taking profits or a transient market downturn, but overall, PEPE is still rising, with weekly and monthly gains of 16% and 795%, respectively, as per CoinStats.
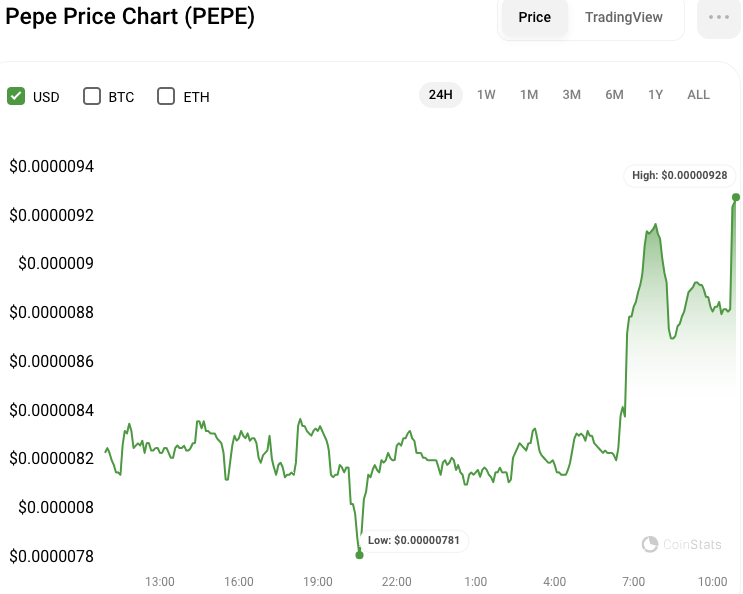
Concurrently, with Bitcoin’s recent all-time high of $73,000 set today, bulls in the PEPE market have nullified the bearish rise of earlier in the day. At press time, PEPE was trading at $0.00000913, up 11% from its previous low, demonstrating strong purchasing pressure and investor confidence in the token’s potential for growth. PEPE’s market capitalization and 24-hour trading volume increased 12.55% and 22.40%, respectively, to $3.91 billion and $1.58 billion.
PEPE/USD Technical Analysis
On the PEPEUSD 24-hour price chart, the Fisher Transform has shifted below its signal line, moving south with a rating of 2.06, indicating that traders may be taking profits and that a trend reversal is possible. The Fisher Transform is a technical indicator that is used to identify potential trend reversals.
With the present Fisher Transform signal and profit-taking activity, traders should proceed cautiously and constantly monitor PEPE’s price movements for any trend reversal indicators. As a result, this could signify a shift in market sentiment and a drop in the token’s price following its recent climb.
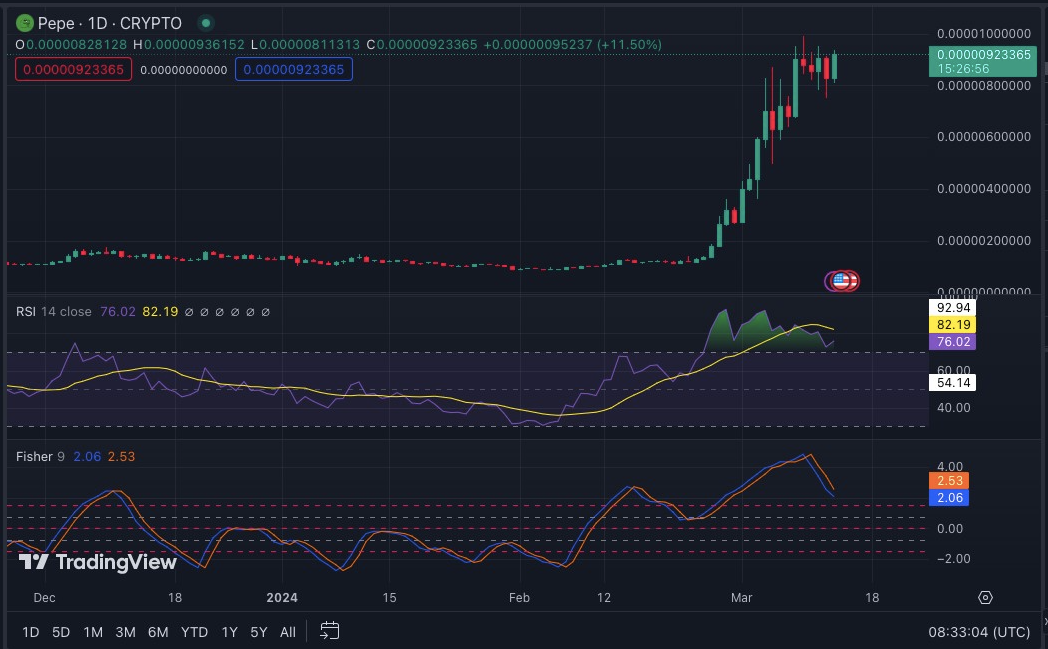
Furthermore, the Relative Strength Index (RSI) falls below its signal line to 75.73 following a spell in the overbought zone, supporting the possibility of a trend reversal. This RSI trend indicates that buying pressure may be lessening and selling pressure may be growing, potentially leading to a drop in PEPE’s price. Therefore, traders should consider setting stop-loss orders and be prepared to adjust their positions accordingly to manage risk effectively.
Disclaimer: The information presented in this article is for informational and educational purposes only. The article does not constitute financial advice or advice of any kind. Coin Edition is not responsible for any losses incurred as a result of the utilization of content, products, or services mentioned. Readers are advised to exercise caution before taking any action related to the company.


