- Polygon’s new partnerships with Polygon zkEVM and Genso pave the way for more price hikes.
- Recent research indicates that the MATIC market has risen during the last day.
- If the bearish pattern holds, signs indicate a price turnaround.
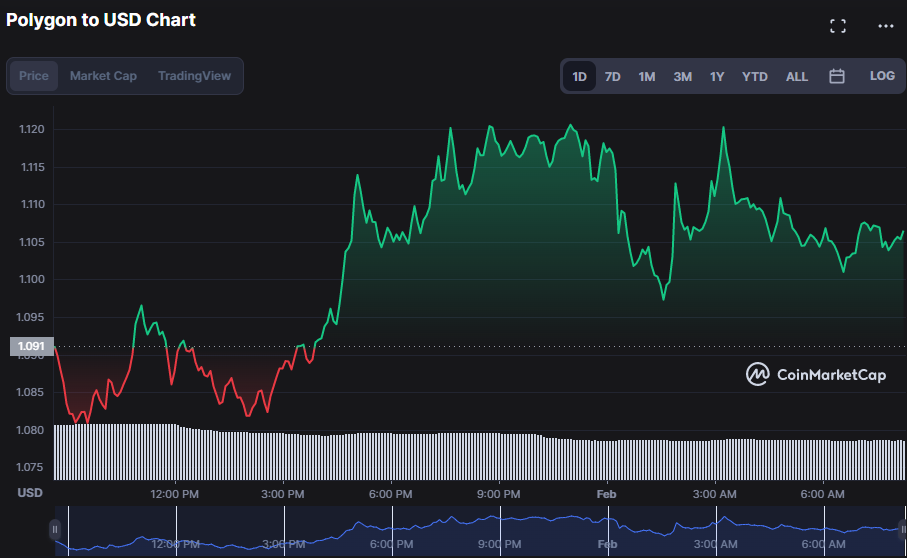
As 2023 progresses, the Polygon (MATIC) market may see significant price gains thanks to its new partnership with Polygon zkEVM and Genso, which boosts confidence and increases market participation. Providing investor and trader enthusiasm remains constant, and this shift strives to send MATIC’s price to new highs. At the time of publication, bullish dominance had taken over the MATIC market, driving the price up by 1.48% to $1.10.
As a result of increased market activity, the market capitalization increased by 1.50% to $9,648,947,213; however, because the 24-hour trading volume decreased by 29.03% to $417,026,760, the strength of the market gains may be jeopardized. However, with new collaborations and increased market activity, the outlook for MATIC’s future development remains optimistic, as this may boost demand even further.

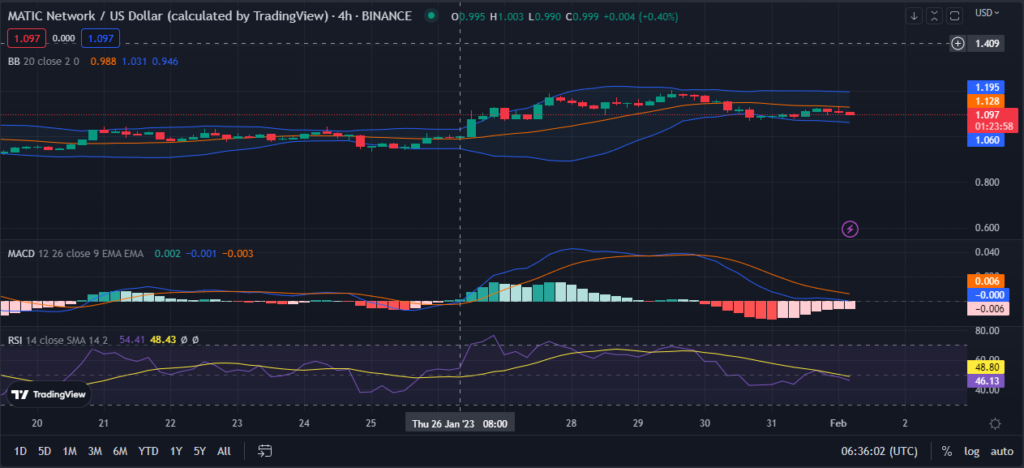
The Bollinger bands’ linear pattern, with the top bar at $1.195 and the lower band at $1.061, implies that the market is steadily going upwards since market prices stay higher than the lower band and lower than the upper band. This motion means that the market is now in an uptrend and may continue to climb in price as long as prices stay inside the upper and lower bands. However, the emergence of a red candlestick signals a loss of steam and the possibility of a trend reversal, portending a decline and warning traders to tread carefully.
In addition, a declining blue MACD line and a reading of -0.001 suggest that bullish momentum is waning, which could signal a near-term reversal if bulls do not provide support.
The Relative Strength Index (RSI) reading of 46.13 corroborates this, indicating that bears are gaining market control and negative momentum is growing. Moreover, the MACD histogram also converges in the negative territory, lending credence to this pessimistic view. In light of this, the market may revert to a negative trend if the bears continue gaining ground and the bulls do not help.

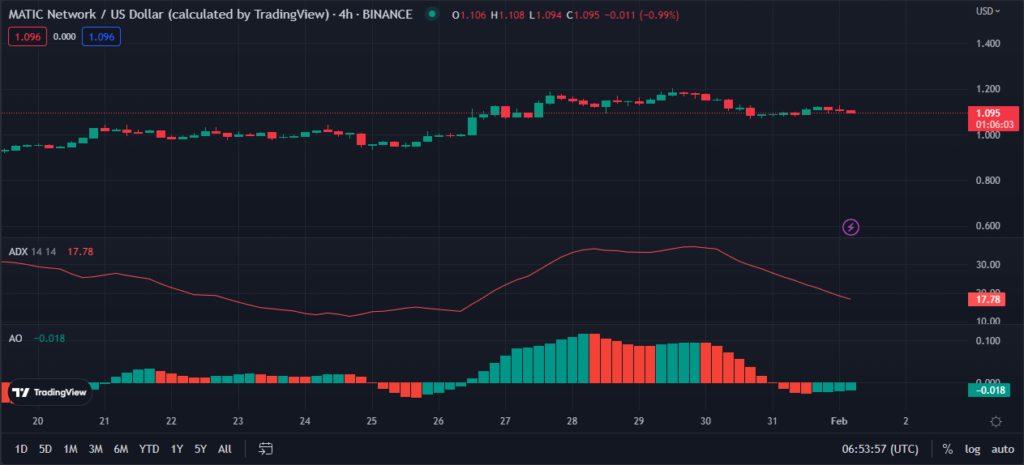
On the MATIC price chart, the Awesome Oscillator (AO) forms green bars below the “0” line with a level of -0.018. This change suggests that buying pressure is waning and bears are beginning to gain control, which could lead to the current bullish trend losing steam and reversing. Conversely, if the Awesome Oscillator starts drawing green bars below the 0 line, buying pressure is waning, and selling pressure is rising, which might lead to a price reversal.
Since ADX values above 25 demonstrate a strong trend, while ADX values below 20 illustrate a lack of trend direction, the current reading of 17.78 and the downward movement of the ADX indicate bears have the upper hand. Therefore, traders should be alert for a possible reversal since this development suggests that the bullish trend is waning and a negative trend may be brewing.

In conclusion, the recent rise in MATIC’s price is due to more activity on the market. However, the strength of these gains will depend on how well the market can hold them.
Disclaimer: The views and opinions, as well as all the information shared in this price analysis, are published in good faith. Readers must do their own research and due diligence. Any action taken by the reader is strictly at their own risk. Coin Edition and its affiliates will not be held liable for any direct or indirect damage or loss.
Disclaimer: The information presented in this article is for informational and educational purposes only. The article does not constitute financial advice or advice of any kind. Coin Edition is not responsible for any losses incurred as a result of the utilization of content, products, or services mentioned. Readers are advised to exercise caution before taking any action related to the company.


