


- Current bullish trend has pushed ADA’s price up by over 2.62%.
- Due to the negative trend, the price of ADA plummeted to a daily low of $0.2728.
- The current upsurge has a decent possibility of continuing, as shown by the ADA market research.
For Cardano (ADA), buyers have emerged to counteract sellers who have driven the price down to an intraday low of $0.2728. Due to the strong market sentiment, the price has increased to $0.2775, a 0.85% increase.
Market value gained as a consequence of this bullish dominance, but 24-hour trading volume has declined by 38.93% since its high. This might signal that investors are treading carefully and cashing out their positions as the price rises. Additionally this might mean that the market is about to undergo a phase of consolidation, with prices leveling out.
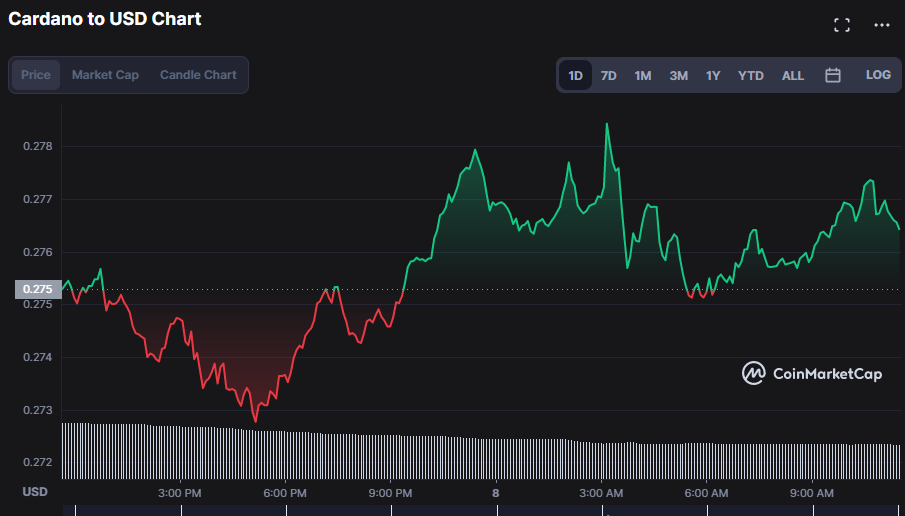
ADA’s price has ranged between $0.2728 and $0.2841 in the previous 24 hours. If the bulls retain control, the price has the potential to break over $0.2850 and set a new all-time high in the coming days. If the bulls keep control, the price might try the next resistance level around $0.2900, while buyers will find support at $0.2800.
However, if buyers withdraw, the bearish trend may escalate, with crucial support levels in the near future around $0.2700 and $0.2650. Long-term investors should look for price dips as entry points into long positions. If prices go below the $0.2650 support level, it might mark the beginning of a negative trend, implying additional losses in the long run.
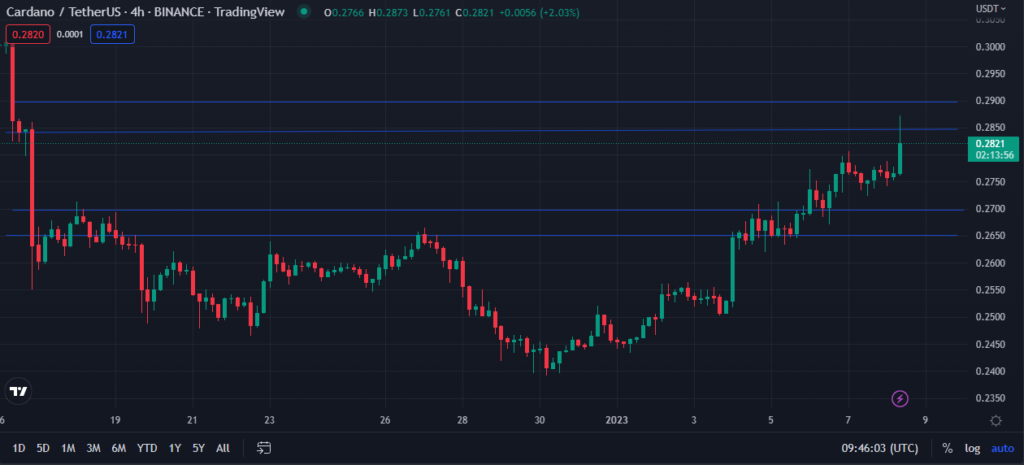
The green candlestick on the ADA price chart indicates that the rally may continue. The closing candlestick and ongoing trend may imply a longer-term increase. As a result, traders must actively observe ADA price movement to see if the trend will continue or reverse. Bullish candles and the uptrend duration demonstrate the strength of the bull trend. Candles that are higher than the market price signal an uptrend and are an ideal entry point. Traders may modify their holdings to profit from the rise. To prevent danger, tighter stops should be employed as ADA concentrates.
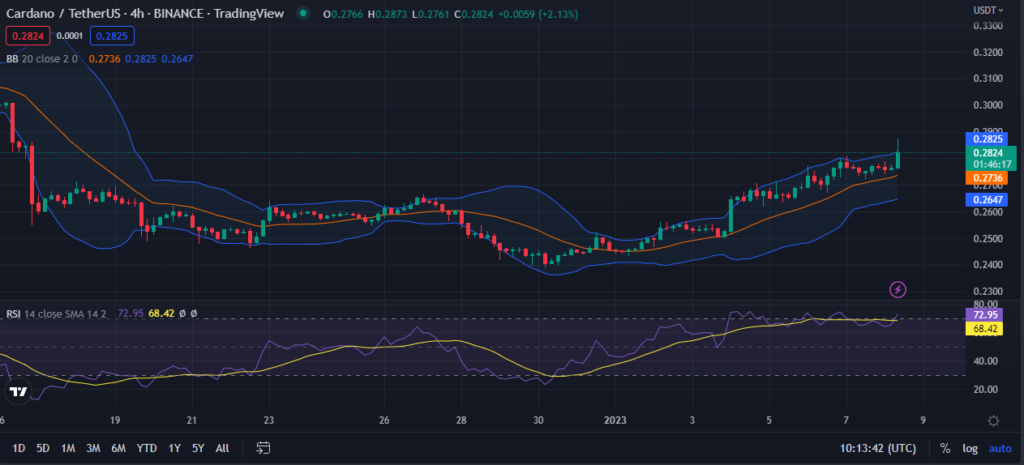
Bollinger Bands rising on the ADA price chart, with the upper band at $0.2826 and the lower band at $0.2646, indicate that ADA volatility is growing and that the asset is enjoying an uptrend. If more investors are looking to acquire the asset, this might indicate that purchasing pressure is rising. This motion suggests that ADA is becoming a good long-term investment option at the present moment, since its value is anticipated to rise more in the future.
The relative strength index (RSI) is now above its signal line at 73.05, indicating that ADA bulls are still in control of the market. A further price hike is anticipated as it approaches the “80” zone of being overbought.
The positive trend in ADA may continue in the near future if the bulls are able to keep the resistance level under their grasp.
Disclaimer: The views and opinions, as well as all the information shared in this price analysis, are published in good faith. Readers must do their own research and due diligence. Any action taken by the reader is strictly at their own risk, Coin Edition and its affiliates will not be held liable for any direct or indirect damage or loss.
Disclaimer: The information presented in this article is for informational and educational purposes only. The article does not constitute financial advice or advice of any kind. Coin Edition is not responsible for any losses incurred as a result of the utilization of content, products, or services mentioned. Readers are advised to exercise caution before taking any action related to the company.

: What Happens If You Use an Unlicensed Platform?")


