
- The death cross on the 4-hour chart indicated that XRP could fall to $0.50
- ADA lacked buying pressure but the golden ratio suggested a move to $0.47.
- TON’s price might fall to $5.50 while SOL could slip to the $161 support.
Many altcoins struggled to make significant gains in the last week of May. According to CoinMarketCap, Ripple (XRP), Cardano (ADA), Toncoin (TON), and Solana (SOL) all traded within tight ranges.
In this analysis, Coin Edition examines the near-term price potential of these cryptocurrencies as the market continues its sideways movement.
XRP Price Analysis
XRP’s price was $0.52 at press time. A look at the Money Flow Index (MFI) on the 4-hour chart showed a reading below the midpoint, indicating capital has flowed out of the XRP market. This suggests upward price movement could be challenging in the short term.
Beyond that, the Exponential Moving Average (EMA) flashed a similar signal. As of this writing, the 50 EMA (yellow) had crossed over the 20 EMA (blue)— a death cross, indicating a bearish trend.
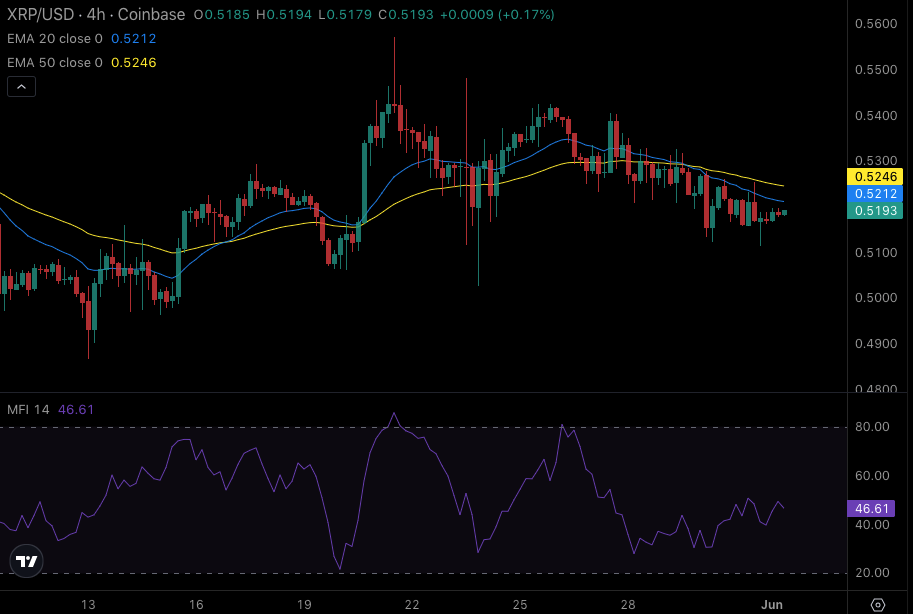
XRP/USD 4-Hour Chart (Source: TradingView)
In addition, XRP was trading below both EMAs, suggesting that the token could find it hard to break past the overhead resistance. Going by this outlook, XRP could drop to $0.50 in the short term.
ADA Price Analysis
ADA’s price was $0.44 at press time. From the chart below, the 0..618 Fibonacci level was at the same point, suggesting that the token might not hit a pullback point that could potentially lead to a price increase.
If the price bounces, ADA could head in the $0.47 direction where the 1.618 golden ratio was located. However, the spot Cumulative Volume Delta (CVD) was down, indicating that the token lacked buying pressure.
Also, the Average Directional Index (ADX) trended downwards, reinforcing the notion that Cardano was weak. While the price might experience a slight jump, ADA might find it difficult to sustain an uptrend.
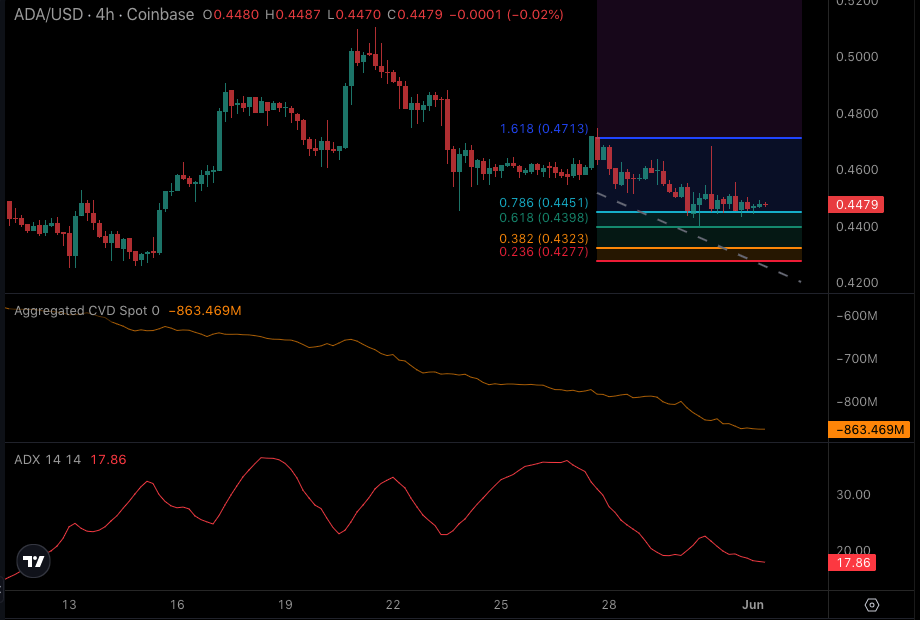
XRP/USD 4-Hour Chart (Source: TradingView)
TON Price Analysis
TON seemed to have lost its bullish momentum as the price of the token fell to $6. Proof of this was shown in the Relative Strength Index (RSI).
At press time, the RSI reading was close to the oversold region of 30.00. With this trend, TON’s price could slip below the $6 region. The Moving Average Convergence (MACD) also shared a similar viewpoint as the reading was negative.
However, the 12 and 26 EMAs on the MACD indicated that bulls and bears were struggling to gain control. A successful attempt for bulls could send TON above $7.15. However, bearish dominance could pull the token down toward $5.50.
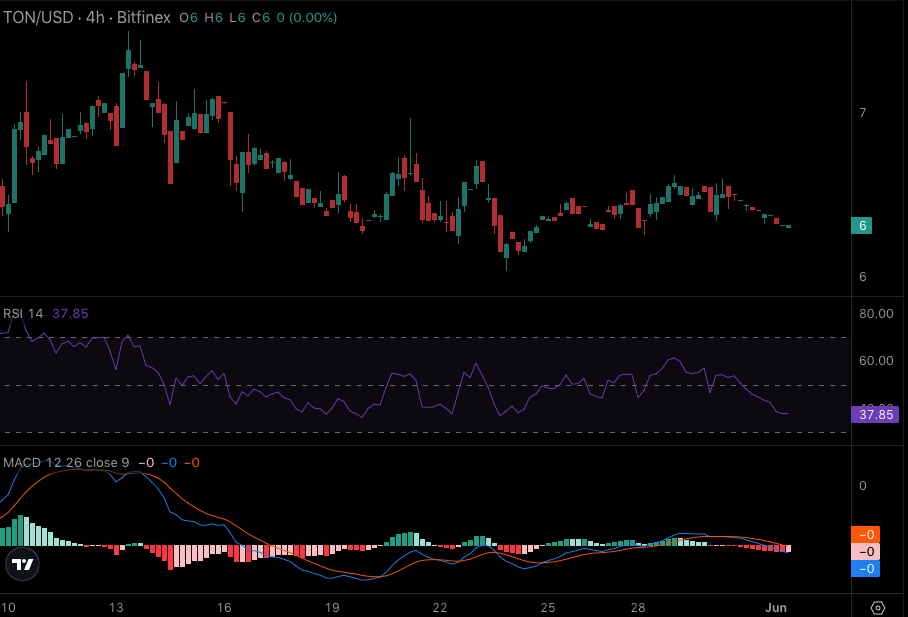
TON/USD 4-Hour Chart (Source: TradingView)
SOL Price Analysis
In recent times, Solana’s price action has been underwhelming, and as it stands, it could remain that way. This was because of the signals shown by the Bollinger Bands (BB).
As of this writing, the BB showed decreasing volatility as the bands contracted. Hence, SOL could keep moving between $164 and $170. Furthermore, the Awesome Oscillator (AO) was negative and indicated an increasing downward momentum.
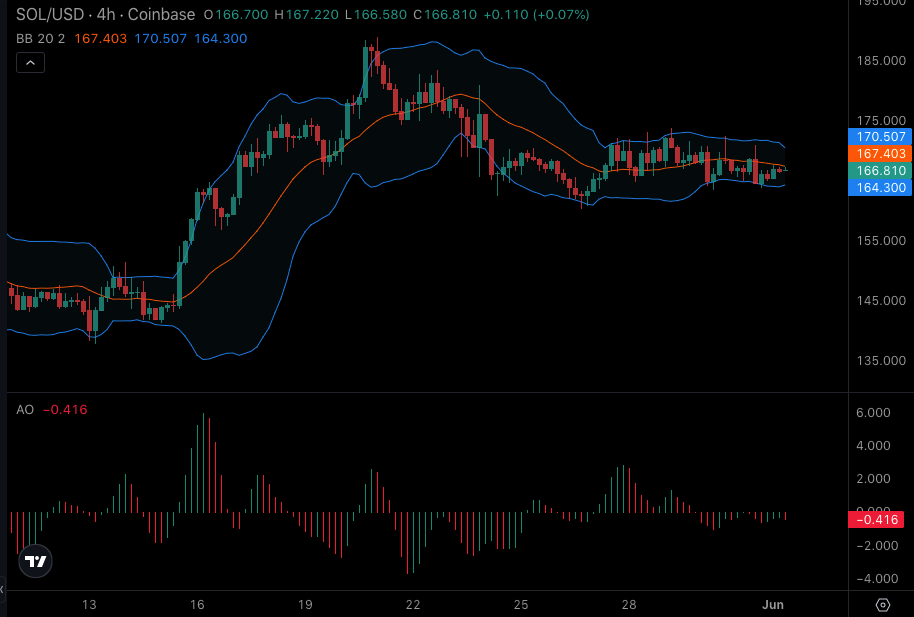
SOL/USD 4-Hour Chart (Source: TradingView)
If this continues, SOL’s price would decrease to the $161 support. However, if the market condition becomes bullish, the price of the token might rally and hit $175.
Disclaimer: The information presented in this article is for informational and educational purposes only. The article does not constitute financial advice or advice of any kind. Coin Edition is not responsible for any losses incurred as a result of the utilization of content, products, or services mentioned. Readers are advised to exercise caution before taking any action related to the company.

 Price Prediction: Can Bulls Reclaim the 0.236 Level?")

 Price Prediction: Can Bulls Break the $329 Barrier?")
