


- ENS is up by over 17.28 % in recent hours.
- The bulls overpower the bears as price surges.
- Technical indicators point to the north.
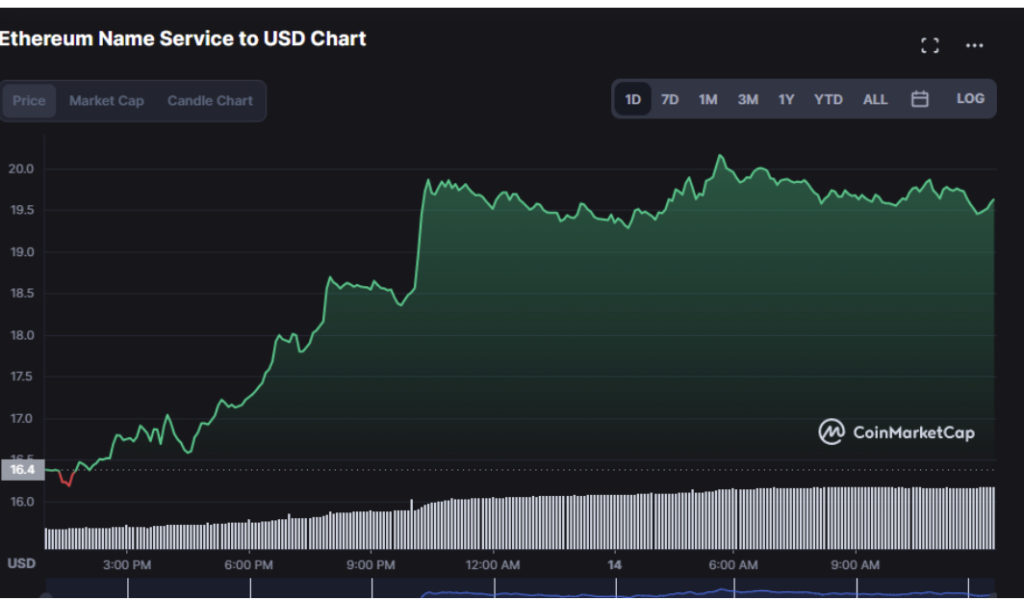
According to pricing information from the Ethereum Name service, the digital currency has had a strong trend, as prices have risen by 17.28 %. Due to this rising momentum, trade volume and market capitalization have surged.
In the past 24 hours, the market capitalization has increased by 19.18% to $398,603,494 and the trading volume has increased by 219.98% to $264,457,357. The bulls were successful in driving up the ENS price, which reached a peak of $19.68 from recent lows of $16.13.
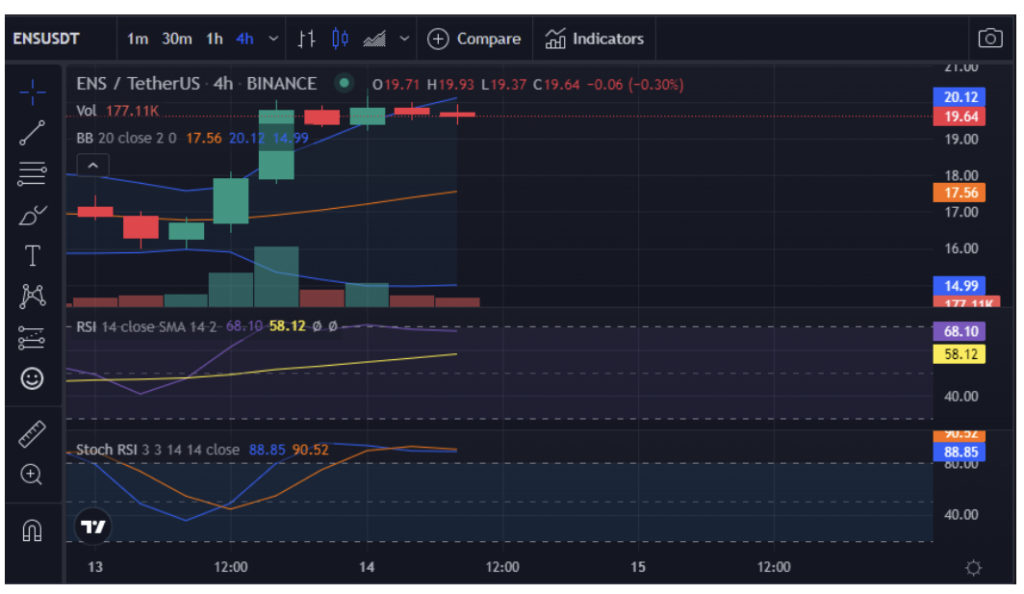
The bulls have had the upper hand in the last 24 hours as they grab control of the market, according to technical indicators on the daily and 4-hour price chart.
The market volatility is rising, which is why there is more purchasing pressure, as indicated by the bulging Bollinger Bands. While the bottom band touches 13.42, the top band touches 19.50. In addition, the market is moving towards the upper band indicating a positive trend.
As the price picks up the stream, a distinct bullish trendline can be seen on the 4-hour chart. With a line reading of 69.48, the Relative Strength Index (RSI) is getting close to the overbought area. The RSI score has been stable over the last few hours, indicating an equal amount of buying and selling activity.
The Stoch RSI has a value of 89.24, which shows that although it is positive in the immediate term, prices may reverse downward as it suggests that the market is ending its present trend. This reading is above the overbought range.
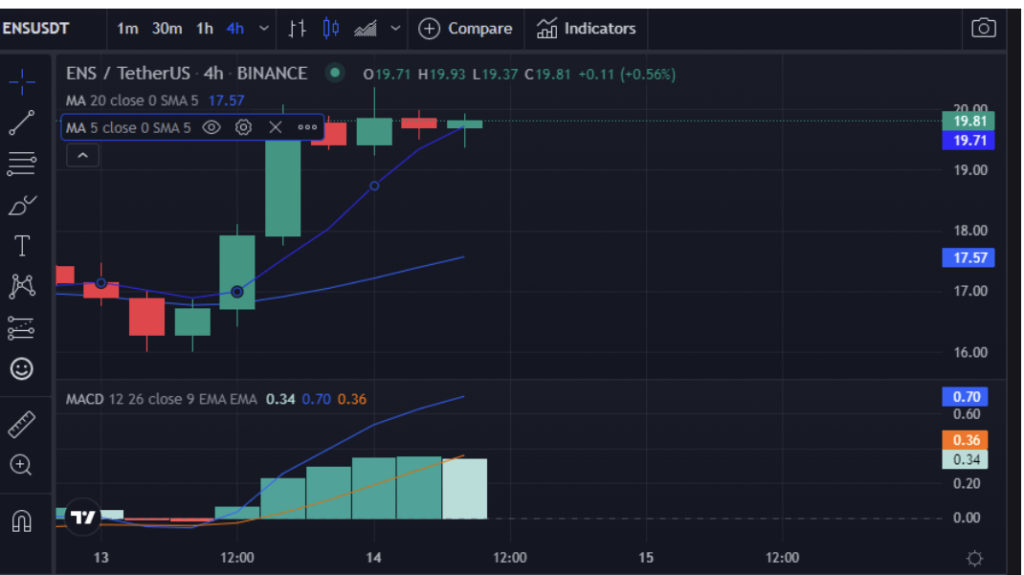
The 5-day Moving Average crossing over the 20-day Moving Average results in a positive crossover on the ENS/USD price chart. The 5 and 20-day moving averages are 17.56 and 19.71 respectively. The fact that the market is above both MAs is a positive sign.
The bulls are in charge of the market and the bullish momentum is gathering strength as the blue MACD line is in the positive region, reading 0.70 and above the signal line. Adding on, the histogram has also been in the positive region which is also a bullish signal.
Bulls are battling to maintain this upward momentum and upswing while attempting to hold prices steady.
Disclaimer: The views and opinions, as well as all the information shared in this price analysis, are published in good faith. Readers must do their own research and due diligence. Any action taken by the reader is strictly at their own risk, Coin Edition and its affiliates will not be held liable for any direct or indirect damage or loss
Disclaimer: The information presented in this article is for informational and educational purposes only. The article does not constitute financial advice or advice of any kind. Coin Edition is not responsible for any losses incurred as a result of the utilization of content, products, or services mentioned. Readers are advised to exercise caution before taking any action related to the company.


