 Price Prediction for July 20, 2025: PENGU Compresses Under $0.033 as Breakout Looms")
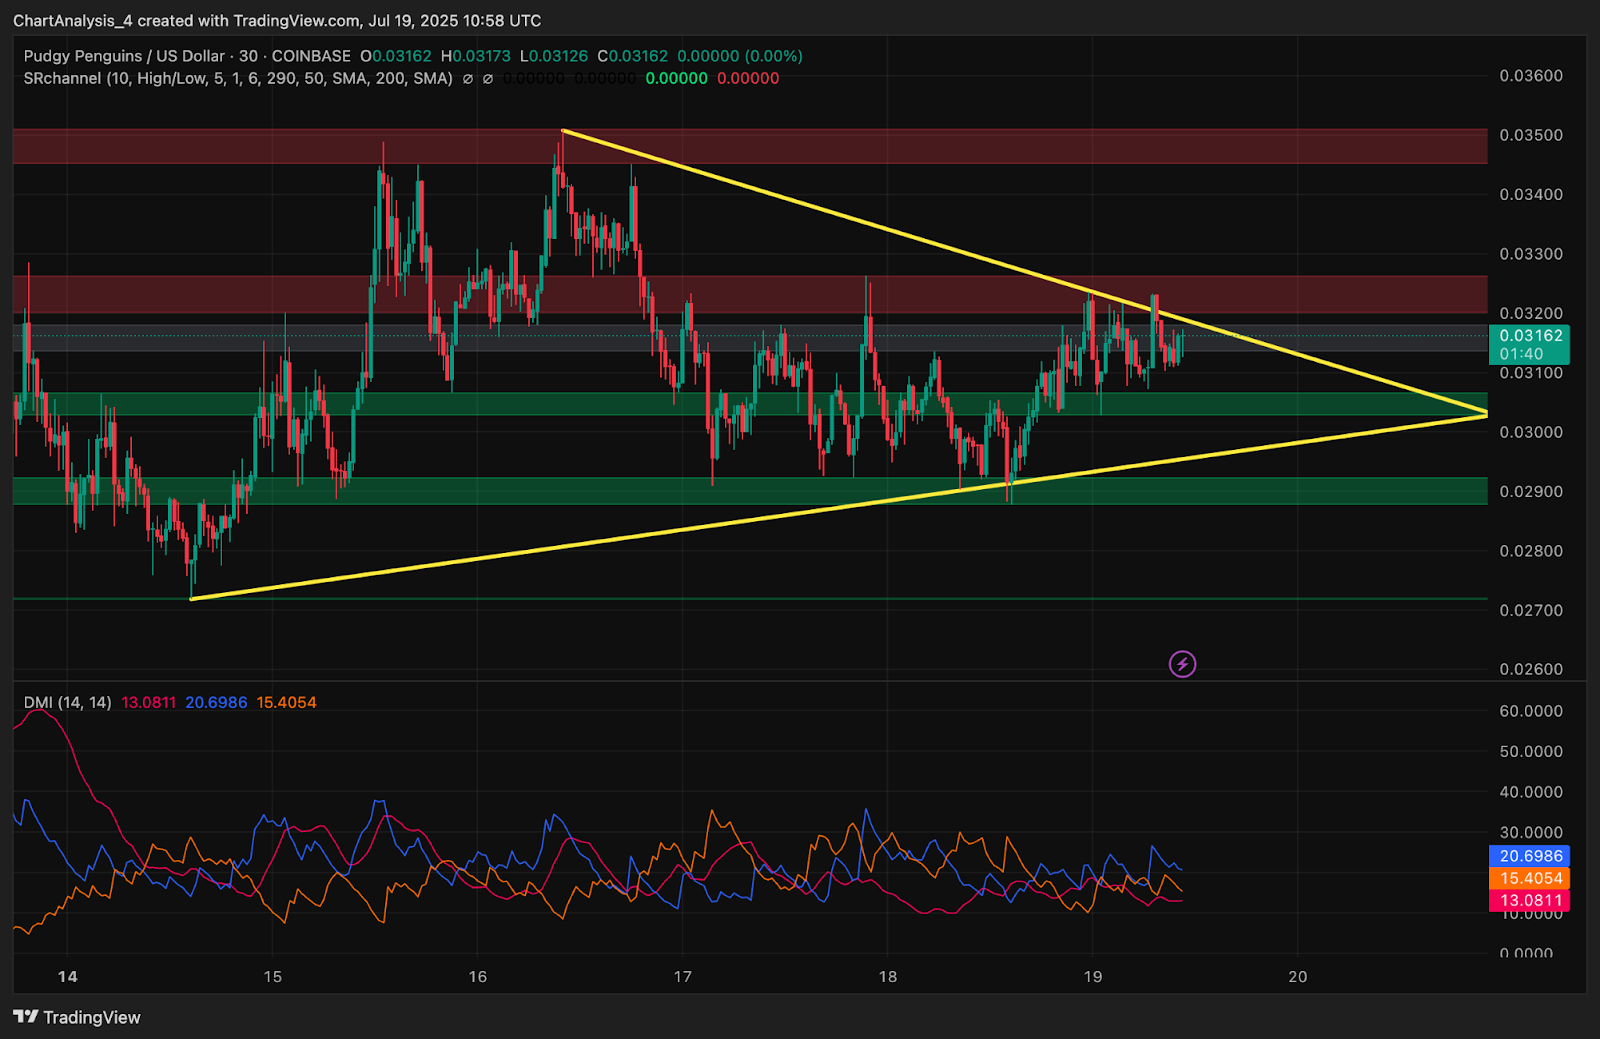
Pudgy Penguins price today is consolidating near $0.0316 after a sharp upside move earlier this month. Despite reaching highs near $0.035, PENGU has failed to make a clear breakout above local supply. The price is now compressing inside a symmetrical triangle, with volatility dropping and momentum indicators flashing early signs of exhaustion. Traders are watching for a directional break as compression nears its apex.
What’s Happening With Pudgy Penguins’ Price?
PENGU price action on the 4-hour chart remains capped under the $0.0335 zone, where previous attempts to break higher were rejected. Price is now coiling within a triangle structure with support near $0.0305 and resistance around $0.0328. This setup reflects indecision after a rapid run-up from sub-$0.020 in early July.
The symmetrical triangle on the 30-minute chart is nearing its conclusion, with price approaching the apex. A breakout above $0.0328 could trigger a rally toward $0.036, while a breakdown below $0.0305 may invite a decline toward $0.0282 or even $0.0246, where prior demand zones are stacked.
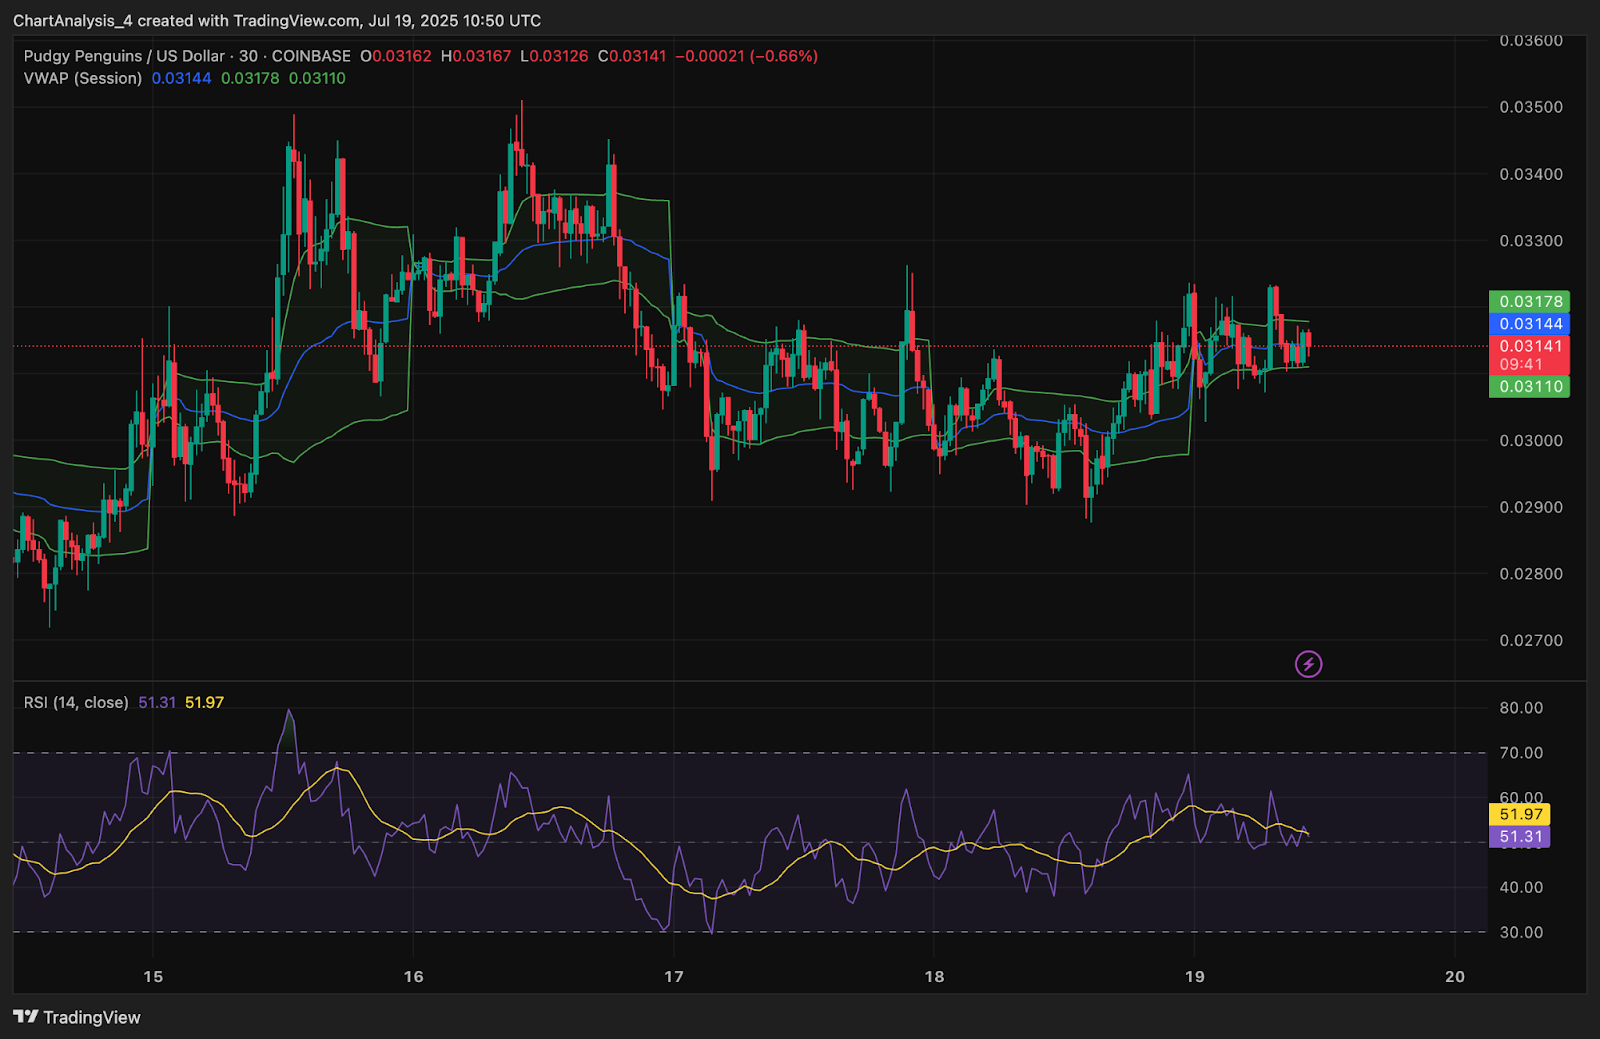
On the 30-minute chart, PENGU is trading tightly around its session VWAP at $0.03144. RSI on this timeframe is flat near 51.3, showing a lack of strong directional bias. The Bollinger Bands are narrowing, further highlighting the low-volatility environment.
Directional Movement Index (DMI) also reflects trend weakness. ADX is below 20, while +DI and -DI are crisscrossing, indicating that neither bulls nor bears have control.
Why Is The Pudgy Penguins Price Going Down Today?
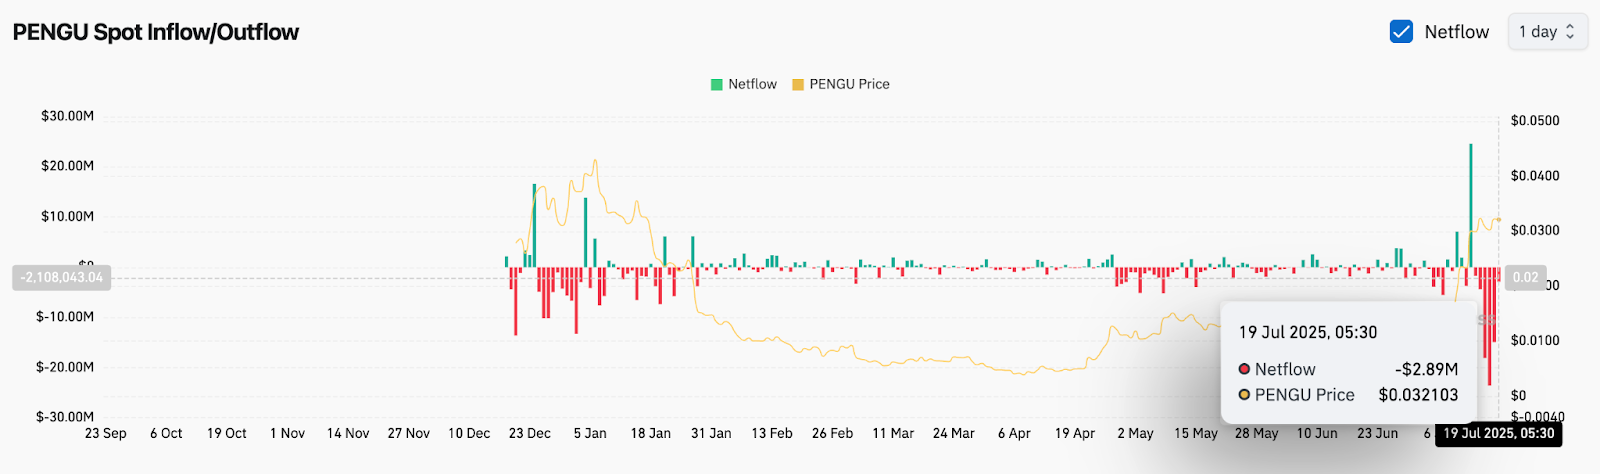
Why Pudgy Penguins price going down today can be attributed to two key drivers — resistance from overhead supply zones and negative spot netflow. On-chain data shows a $2.89 million net outflow on July 19, suggesting that recent buyers are taking profits or redistributing. The lack of sustained capital inflow is capping upward momentum despite the earlier rally.
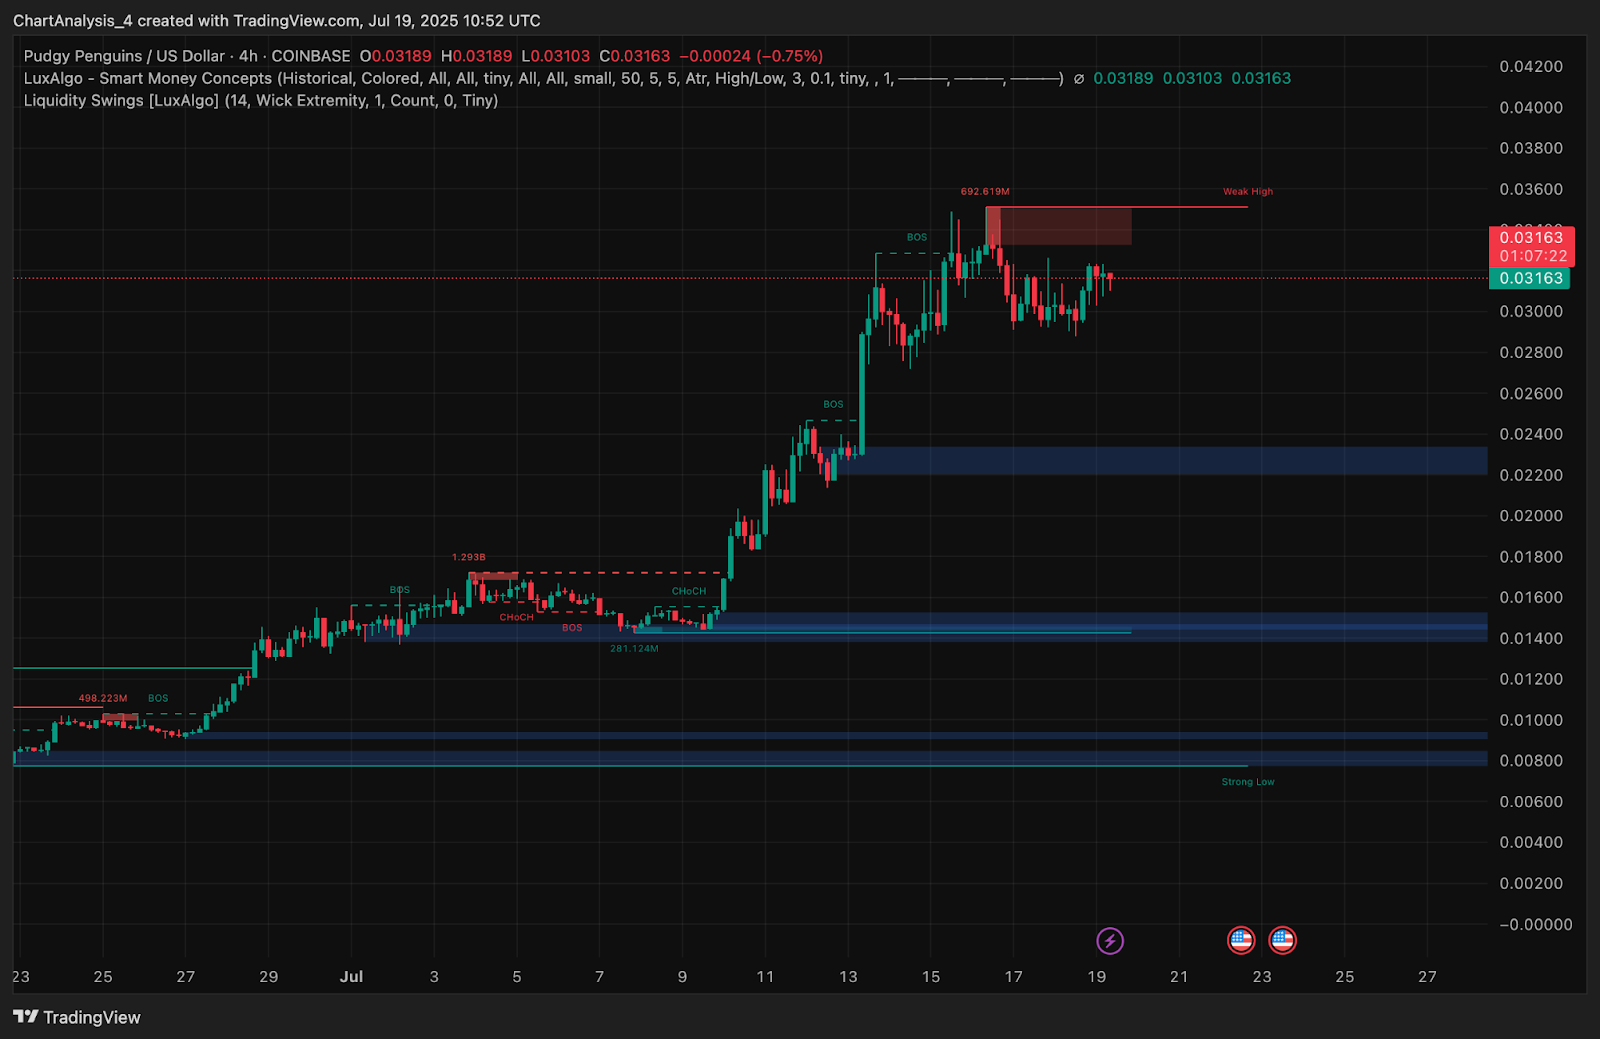
From a technical perspective, price is reacting to the smart money CHoCH (Change of Character) and weak high zone around $0.034–$0.035. Liquidity has been swept at these levels multiple times, but PENGU failed to maintain gains, which indicates that larger players are offloading during spikes.
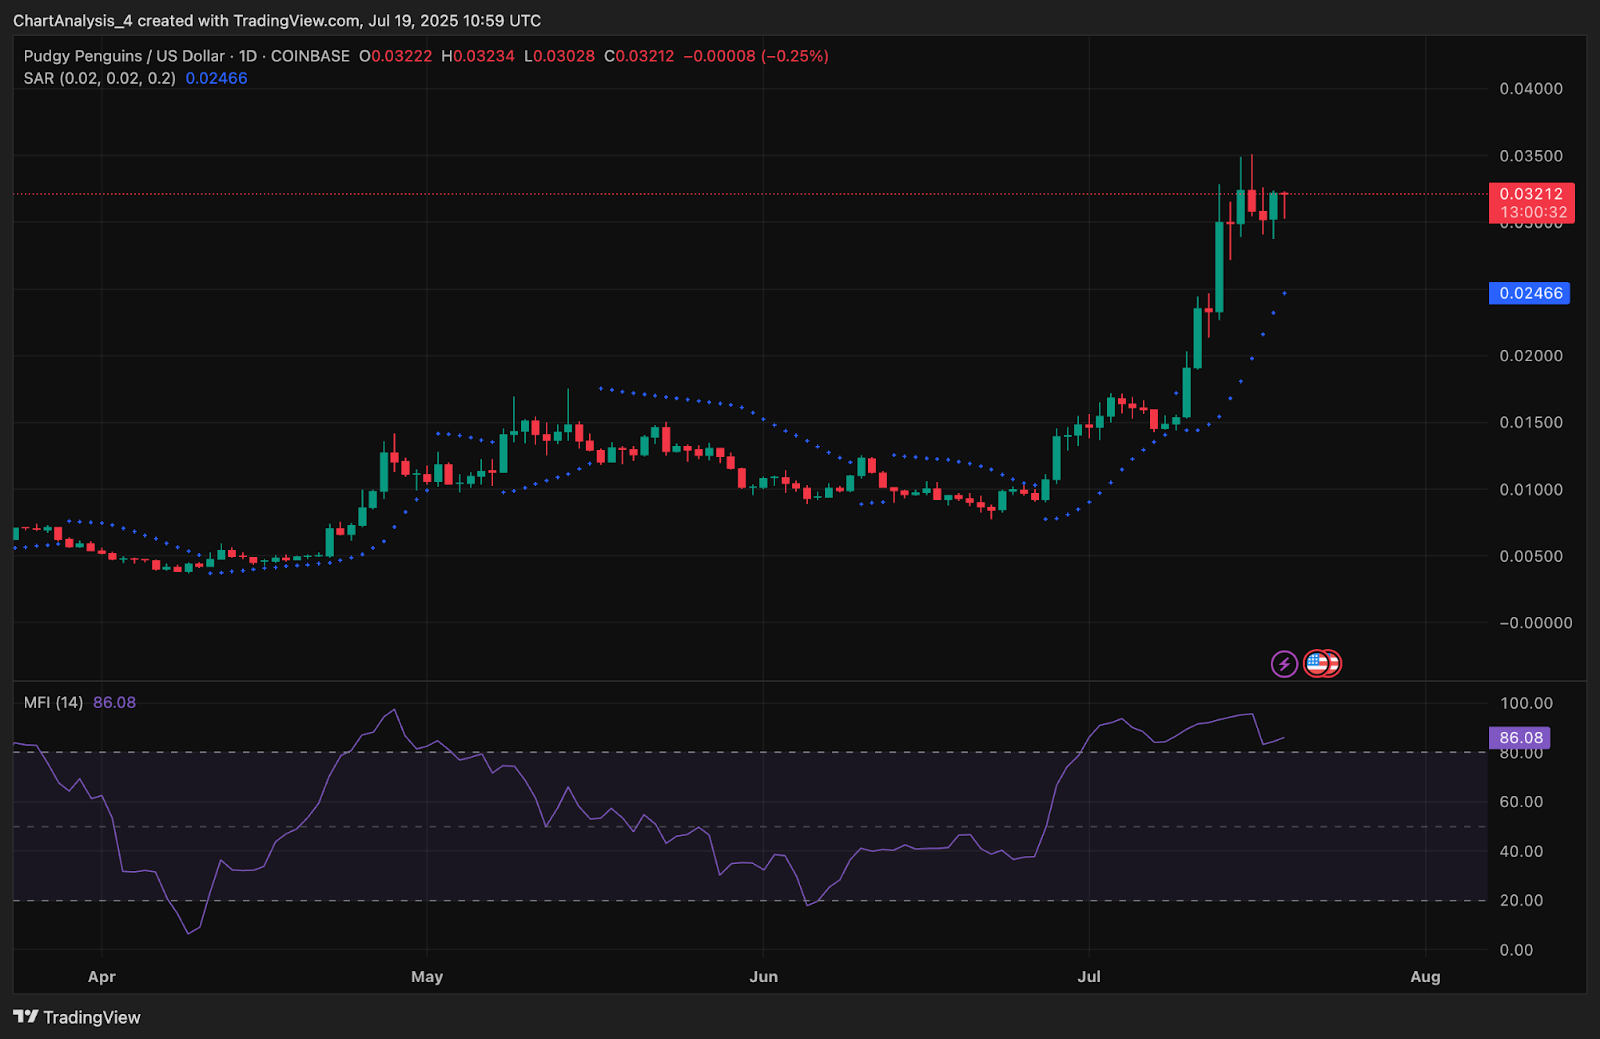
Meanwhile, the Money Flow Index (MFI) is at an overheated level of 86.08 on the daily chart, suggesting a pullback or consolidation was overdue. Parabolic SAR also flipped above price recently, indicating a short-term bearish bias.
Consolidation Structure and EMAs Show Decision Point Near
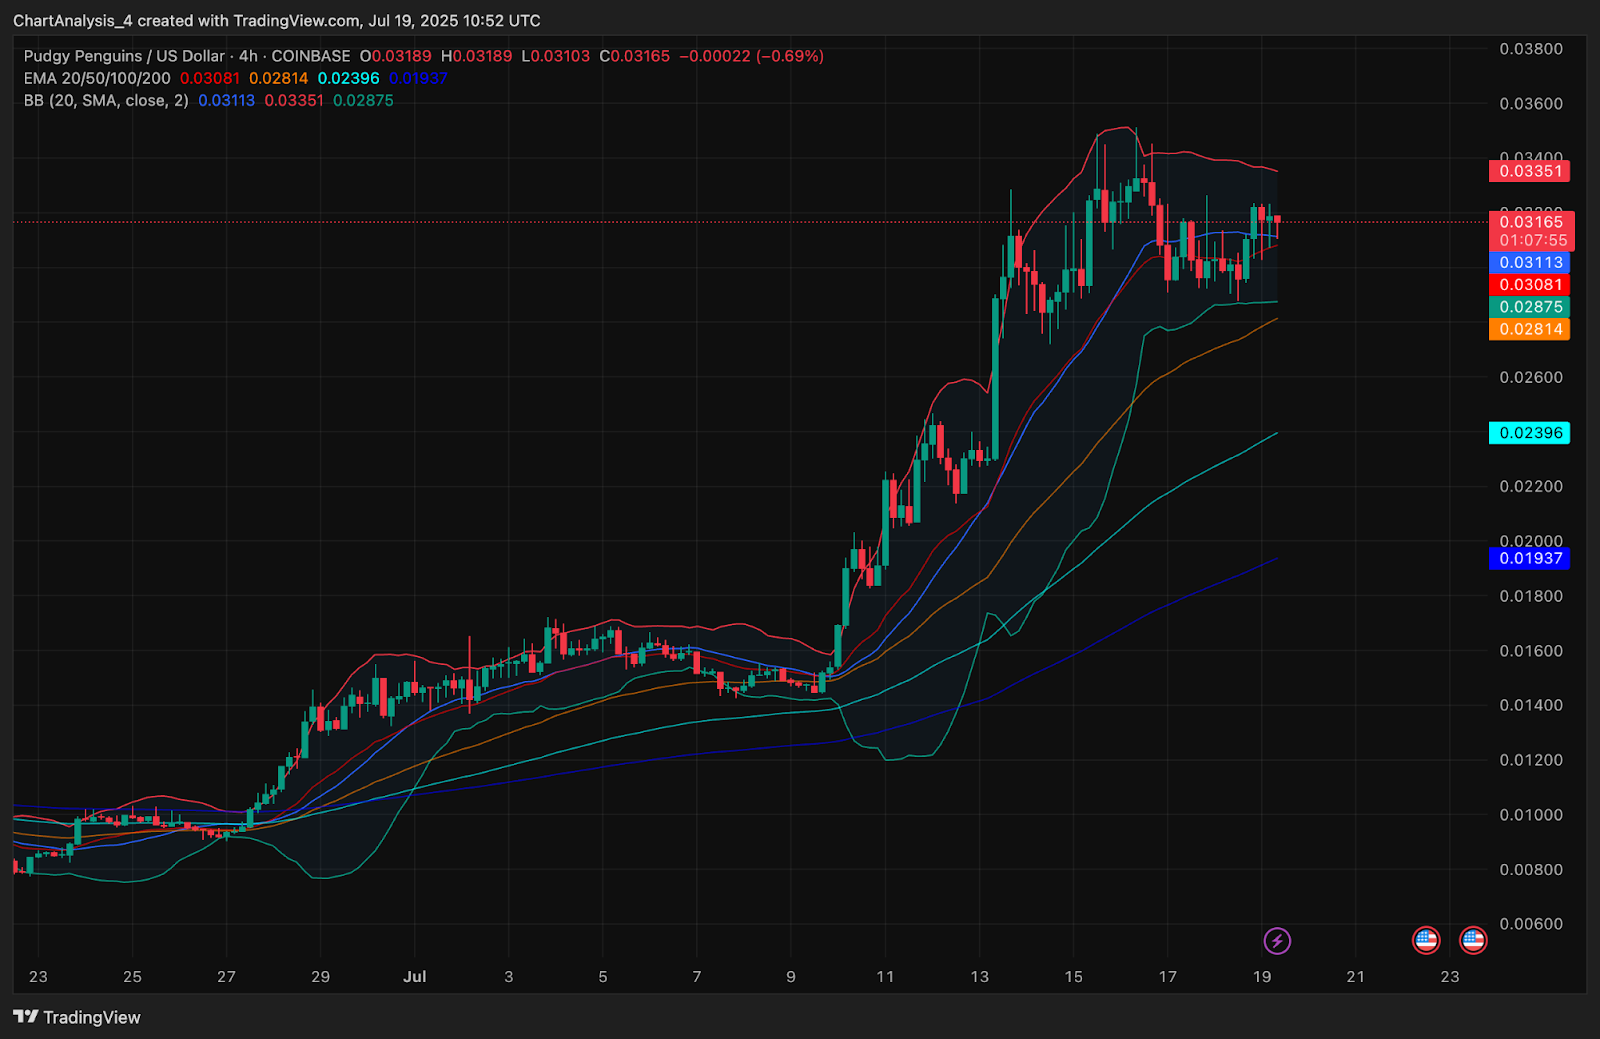
On the 4-hour Bollinger Band setup, PENGU price is oscillating between the mid-band ($0.0311) and upper resistance at $0.0335. The EMAs are still bullishly aligned, with EMA20 and EMA50 sitting at $0.0308 and $0.0281 respectively. These dynamic supports will be key if the triangle resolves to the downside.
Price is still above the 200 EMA on higher timeframes, so the macro structure remains intact. But failure to break the current resistance zone could lead to a deeper retest before any new leg higher.
PENGU Price Prediction: Short-Term Outlook (24h)
In the next 24 hours, Pudgy Penguins price is expected to remain range-bound between $0.0305 and $0.0328 unless a breakout is triggered. Given the low volatility, volume and structure at the triangle edge will be the primary breakout indicators.
If bulls reclaim $0.0335 with a close above the weak high, the path toward $0.0355 and $0.038 becomes open. On the downside, a breakdown below $0.0305 could lead to a pullback toward the $0.028–$0.026 liquidity zone.
Traders should monitor volume spikes and VWAP shifts closely during the U.S. session for signs of resolution.
Pudgy Penguins Price Forecast Table: July 20, 2025
| Indicator/Zone | Level / Signal |
| Pudgy Penguins price today | $0.0316 |
| Resistance 1 | $0.0328 |
| Resistance 2 | $0.0355 |
| Support 1 | $0.0305 |
| Support 2 | $0.0280 |
| VWAP (30-min) | $0.03144 (neutral) |
| RSI (30-min) | 51.31 (flat) |
| MFI (Daily) | 86.08 (overbought) |
| Parabolic SAR | Bearish (dots above price) |
| Bollinger Bands (4H) | Compressing (volatility squeeze) |
| Netflow (July 19) | -$2.89M (bearish outflow) |
| Triangle Breakout Zone | $0.0328 (bullish trigger) |
Disclaimer: The information presented in this article is for informational and educational purposes only. The article does not constitute financial advice or advice of any kind. Coin Edition is not responsible for any losses incurred as a result of the utilization of content, products, or services mentioned. Readers are advised to exercise caution before taking any action related to the company.


