
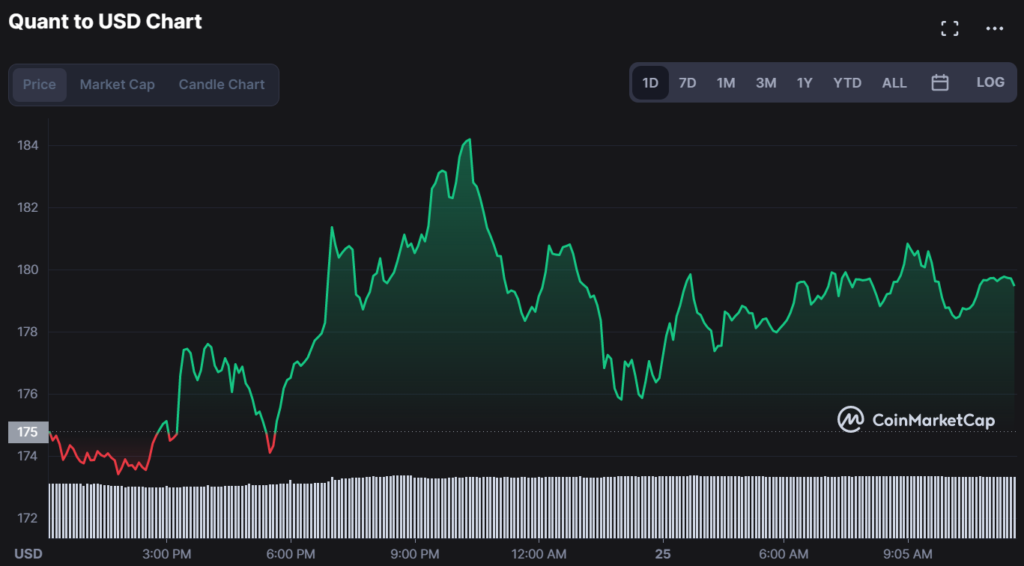
- Quant price analysis shows QNT has gained over 2.61% in the last 24 hours.
- QNT is currently testing the key resistance level of $180.0
- The immediate support level for QNT is present at $175.42
According to technical analysis, Quant appears to be in a strong uptrend and has shown significant resistance at higher levels. The altcoin has been impressively progressing with a steady price increase over the past month. Quant is trading at $178.91 after successively breaking through resistance levels at $175, $178, and $179.
The Fibonacci retracement levels also show that QNT has room for further growth, with the next key resistance level at $200. Additionally, the relative strength index and the moving average convergence divergence indicate a bullish trend for Quant.
The moving average lines used to measure short and long-term trends further reinforce the uptrend, with the 50-day MA above the 200-day MA. Also, the exponential moving average EMA’s, specifically the 10-day EMA and the 20-day EMA, have crossed over, indicating a bullish trend.
The weekly chart for QNT/USD pair indicates the RSI value is above 60, and the MACD line is above the signal line, indicating a solid uptrend. The MACD line is also diverging positively, indicating that buying pressure is increasing.
Looking at the important resistance and support levels, Quant appears to have room for further growth in the short term. The key resistance level for the QNT/USD pair is currently at $180.0, with the immediate support level present at $175.42.
Looking at the longer term, Quant has potentially positive fundamentals with its Overledger technology and partnerships with companies such as Oracle. This, coupled with strong market sentiment, could lead to further gains for QNT in the future.
Out of the 28 technical indicators, 27 are currently giving a buy signal for Quant. The technical indicators on the 4-hour chart also support the bullish trend, with the RSI being above 50 and the MACD line above the signal line.
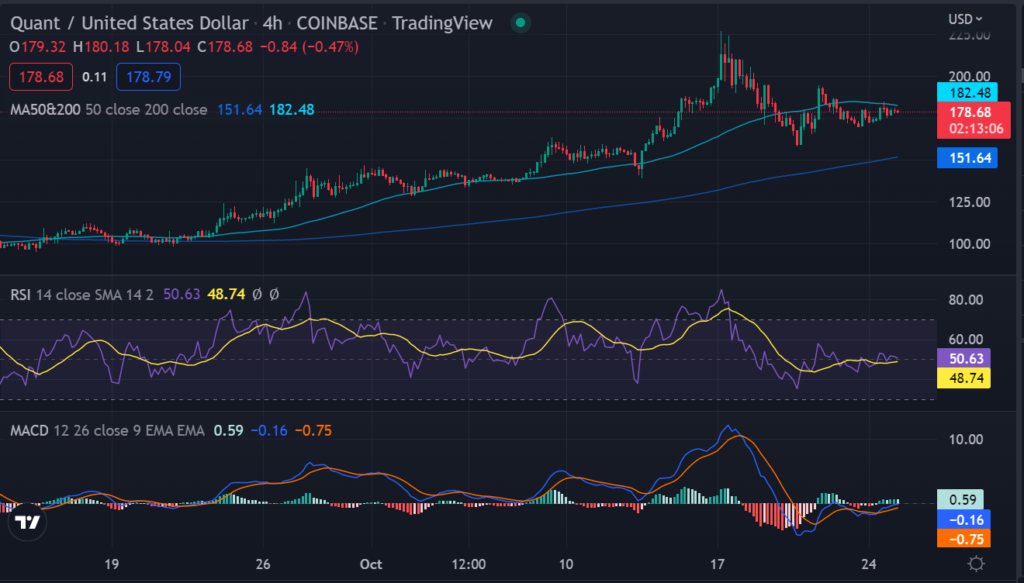
On the daily chart, a bearish crossover of MACD can result in a drop towards $166 and $159 support levels. The RSI line on the daily chart is currently at 58, indicating that the coin is nearing overbought levels, and investors should exercise caution. However, a break above $180 could lead to further gains for Quant in the short term.
Disclaimer: The views and opinions, as well as all the information shared in this price prediction, are published in good faith. Readers must do their research and due diligence. Any action taken by the reader is strictly at their own risk. Coin Edition and its affiliates will not be held liable for any direct or indirect damage or loss.
Disclaimer: The information presented in this article is for informational and educational purposes only. The article does not constitute financial advice or advice of any kind. Coin Edition is not responsible for any losses incurred as a result of the utilization of content, products, or services mentioned. Readers are advised to exercise caution before taking any action related to the company.
")


