


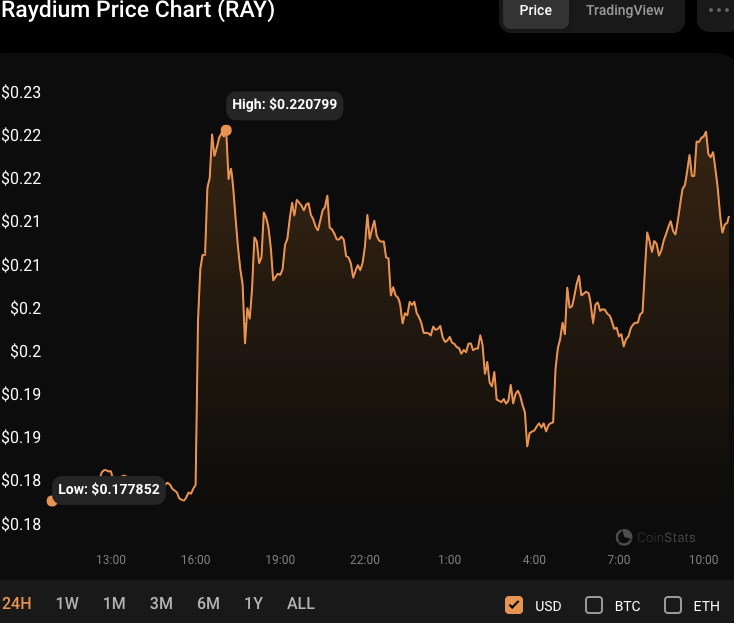
- RAY’s price surge to $0.223 sparks bullish momentum, eyeing $0.240 resistance.
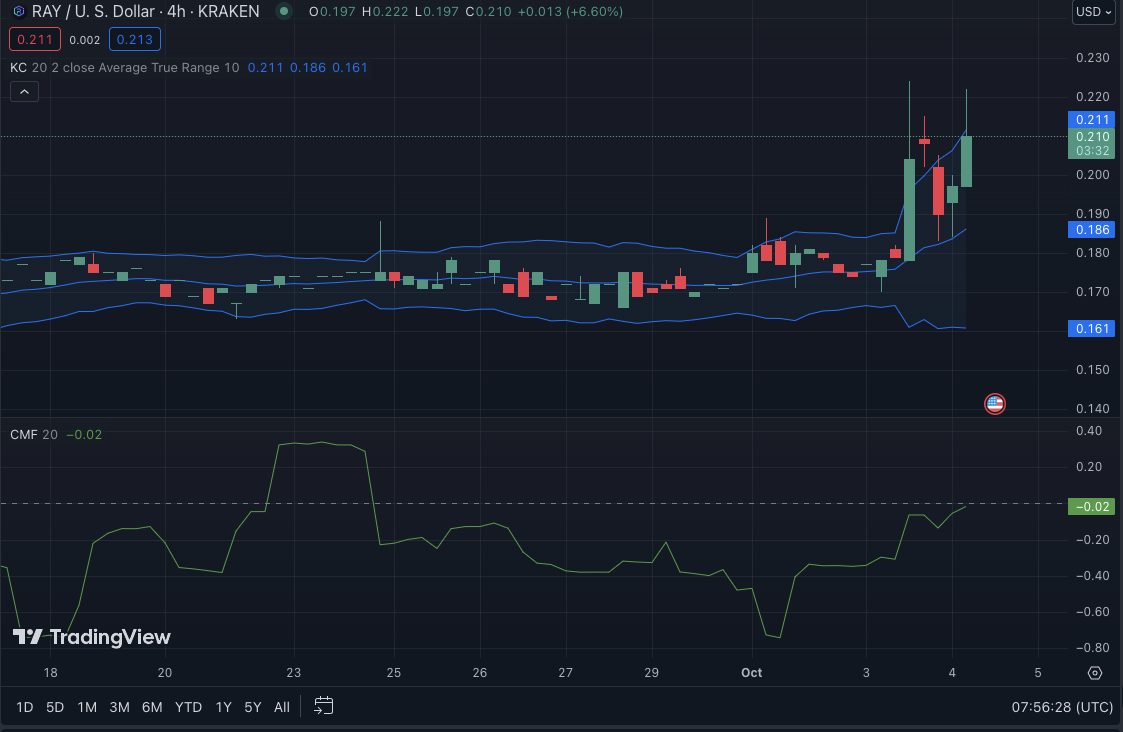
- Keltner bands widen, signaling potential swings despite overbought conditions.
- High volatility and positive TRIX suggest a strong upward trend but beware of reversals.
Raydium (RAY) has seen significant bullish enthusiasm in the past 24 hours, with bulls driving the price from an intraday low of $0.1754 to a 4-week high of $0.223. RAY was trading at $0.2209 at press time, a 25.03% increase from its intraday low.
If bulls break over the $0.223 barrier, the next level to monitor is $0.240. This level has often served as a solid barrier to RAY’s price movement, and a breach might spark more positive momentum.
However, suppose bears successfully drive the price below the current support level of $0.220. Consequently, the next support to watch is $0.205, which may draw buying activity and prevent additional negative pressure.
Furthermore, RAY’s market capitalization and 24-hour trading volume climbed by 25.08% and 1907.86%, respectively, to $51,467,282 and $40,693,870, showing higher investor activity and price volatility.
The Keltner Channel bands are broadening on the RAYUSD 4-hour price chart, with the top, middle, and lower bands at $0.211, $0.186, and $0.161, respectively. This movement suggests that price swings and possible breakout chances are becoming more likely. However, the price activity in the top range shows that the market is overbought and could suffer a dip shortly.
With a Chaikin Money Flow (CMF) of -0.03 and a positive slope, the RAYUSD market sees a modest influx of capital. This phase suggests some purchasing pressure, but more is needed to raise the price drastically. If the CMF rating rises and reaches a positive figure, it might suggest more purchasing pressure, eventually leading to a market breakout.
The Relative Volatility Index (RVI) value of 75.84 suggests that the RAY market is presently volatile. This movement implies that there might be large price volatility and trading possibilities for investors. If the RVI rises, it may signal more volatility and the probability of bigger price movements. However, investors should exercise caution since extreme volatility increases the likelihood of risk.
Additionally, the TRIX rating of 23.09 indicates that RAY’s price momentum is now favorable. This level demonstrates the intensity of RAY’s rising trend and implies high purchasing pressure. However, if the TRIX rating falls, it might indicate a possible reversal in RAY’s price trend.

In conclusion, Raydium (RAY) shows signs of bullish enthusiasm, but caution is advised due to increasing volatility and potential market swings.
Disclaimer: The information presented in this article is for informational and educational purposes only. The article does not constitute financial advice or advice of any kind. Coin Edition is not responsible for any losses incurred as a result of the utilization of content, products, or services mentioned. Readers are advised to exercise caution before taking any action related to the company.


