


 Price Prediction 2024-2030: Will RNDR Price Hit $20 Soon?")
- The bullish RNDR price prediction ranges from $8.526 to $59.23.
- Analysis suggests that the RNDR might also reach $14.00 in 2024.
- RNDR’s bearish market price prediction for 2024 is $1.257.
Render (RNDR) has showcased a volatile yet compelling price trajectory in recent years, capturing the attention of the cryptocurrency community. The token’s historical price chart reveals an impressive rally, peaking at an all-time high of $13.60 in March 2024.
This surge marked a gain of over 36,000% from its 2020 low of $0.03676, underscoring the project’s potential in the decentralized GPU rendering sector. Following this high, however, RNDR experienced a correction, losing over 51% from its peak, stabilizing around $6.6 at press time.
Recent technical charts indicate RNDR finding support around $4.01, which has acted as a key base for its current recovery. Moreover, the weekly candles show renewed investor interest, with a 31.77% rise in the last week alone, hinting at possible bullish momentum.
As the market anticipates RNDR’s next moves, the question remains: will this bounce lead to a sustained upward trend, or is another period of consolidation on the horizon? Let’s find out more in this Coin Edition’s price prediction article.
Table of contents
- What is Render (RNDR)?
- RNDR Current Market Overview
- Render (RNDR) Price Analysis
- Render (RNDR) Price Prediction 2024
- Render (RNDR) Price Prediction 2025
- Render (RNDR) Price Prediction 2026
- Render (RNDR) Price Prediction 2027
- Render (RNDR) Price Prediction 2028
- Render (RNDR) Price Prediction 2029
- Render (RNDR) Price Prediction 2030
- Render (RNDR) Price Prediction 2040
- FAQs
What is Render (RNDR)?
RNDR is the advanced token at the heart of the Render Network, a decentralized solution for GPU rendering in the creative industry. In a field where high-quality visual content demands intensive computing power, RNDR offers an affordable and efficient alternative by connecting creators with a global network of GPU providers.
Instead of relying on costly centralized services, creators can use RNDR tokens to access distributed GPU resources, transforming rendering. In addition, the Render Network operates as a decentralized marketplace where 3D artists, animators, and other creatives submit rendering jobs and pay with RNDR tokens, while GPU owners execute the tasks and earn tokens in return.
This system streamlines costs and opens up powerful GPU capabilities to a broader audience, enhancing scalability and efficiency. By decentralizing this resource-heavy process, Render (RNDR) fuels a thriving ecosystem where creators can achieve more without breaking the bank. Notably, the network’s blockchain-based structure ensures security, transparency, and fair compensation, making RNDR a key player in the digital creativity landscape.
RNDR Current Market Overview
RNDR has shown impressive gains over the past month, with its price climbing from around $5.48 to the current level of $6.59. This represents an upward trajectory, reflecting a robust monthly performance. The weekly chart highlights an even steeper climb, where RNDR recorded a 31.77% gain, further affirming investor interest and market confidence in the token’s potential.
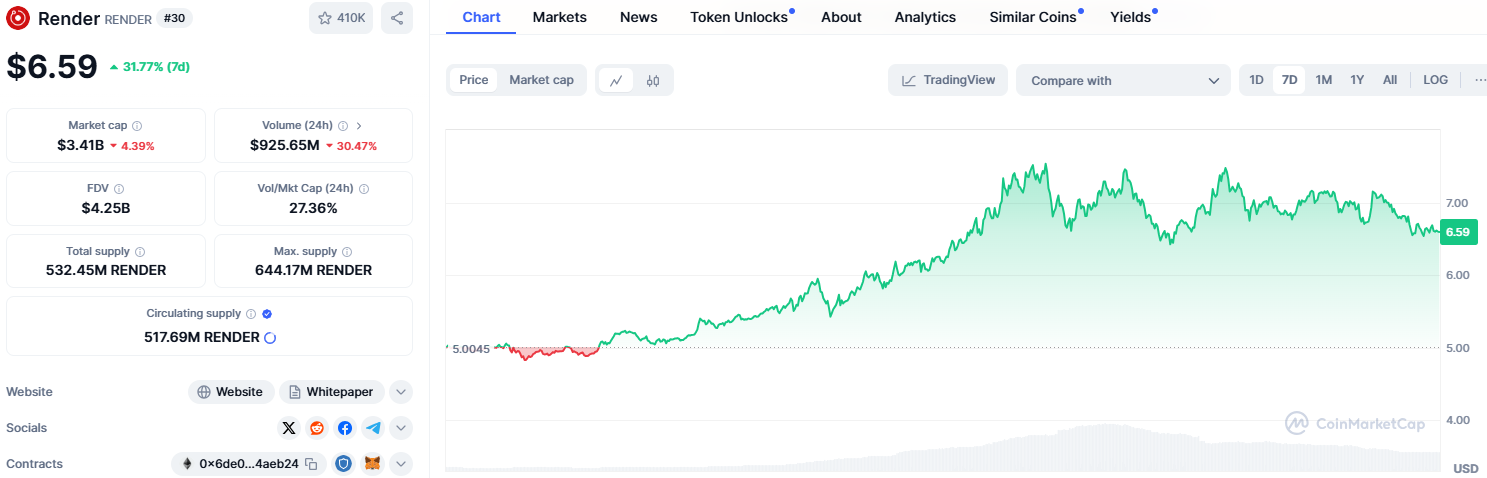
As of press time, the token’s market cap stands at $3.41 billion, with a 24-hour trading volume of $925.65 million, indicating a robust liquidity profile. The volume-to-market cap ratio of 27.36% further underscores the asset’s active trading status. With a circulating supply of 517.69 million RNDR tokens, Render is approaching its maximum supply of 644.17 million.
Render (RNDR) Price Analysis
Per technical indicators, the RNDR cryptocurrency is riding a bullish wave, with the current sentiment reflecting strong positive momentum. The Fear & Greed Index is 88, signaling Extreme Greed among investors.
In addition, over the past month, RNDR has seen green on 13 out of 30 days, translating to a 43% win rate and displaying a price volatility of 11.69%. But does this bullish sentiment mean it’s the right moment to invest in RNDR?
In this section, Coin Edition delves into RNDR’s potential price path, utilizing essential technical indicators and real-time data to offer valuable insights into what may lie ahead.
Render (RNDR) Price Analysis – Bollinger Bands
The Bollinger Bands on the chart suggest decreasing volatility for the RNDR token as the upper band at $7.1550 approaches the lower band at $3.8885. Recently, the token surged toward the upper band but retraced after briefly exceeding it. However, it remains above the middle band at $5.52, which currently acts as a support level, indicating continued bullish sentiment despite the minor retracement.
If bullish momentum picks up again, RNDR could aim to close above the upper band, likely nearing the 61.8% Fibonacci level at $8.52. Conversely, a rejection may prompt a retest of support around the middle band, with a potential dip to the lower band for added stability.
Render (RNDR) Price Analysis – Relative Strength Index
The chart’s Relative Strength Index for RNDR sits at 52.02, indicating a neutral zone where neither bullish nor bearish momentum dominates. This placement above the midpoint 50 suggests a slight bullish sentiment, though it’s not overbought territory.
However, if the RSI continues to rise towards the 70 level, it could signal increased buying pressure, potentially leading to a price rally. Conversely, if the RSI dips below 50, it may indicate a shift toward bearish momentum, with RNDR potentially retesting support levels around $5.37 or lower if selling pressure intensifies.
Render (RNDR) Price Analysis – Moving Average Convergence Divergence
The MACD indicator for RNDR shows a bullish crossover, with the MACD line at -0.3949 above the signal line at -0.4630. This crossover suggests a potential upward trend as buying momentum strengthens. Moreover, the histogram bars have started to turn positive, indicating a shift in momentum.
If the MACD line continues to rise above the signal line, it could support further price increases, with RNDR reaching the 61.8% Fibonacci level at $8.52. However, if momentum weakens and the MACD line falls below the signal line, a potential reversal to lower support levels may occur.
Render (RNDR) Price Prediction 2024
The DMI for RNDR shows a mild bullish signal, with the +DI at 24.6908 above the -DI at 17.0651. This suggests that the buyers are stronger than the sellers, indicating potential upward momentum. However, the ADX stands at 16.2167, which reflects weak trend strength.
If the ADX rises above 20 while +DI remains dominant, it could signal a stronger bullish trend. Conversely, if the ADX fails to increase, RNDR’s price may lack enough momentum to sustain significant gains, potentially consolidating near its current levels.
Under these market conditions, RNDR could likely challenge its all-time high near the $14.00 mark if the current bullish sentiment continues over the long term. However, if sentiment shifts, a pullback toward the $3.42 support level may occur, with the possibility of a deeper drop to around $1.25, providing a safety net in a more bearish scenario.
Render (RNDR) Price Prediction 2025
According to Coin Edition’s projections, RNDR could reach as high as $30.62 in 2025, driven by renewed market interest following the 2024 Bitcoin halving. Conversely, a market correction might see RNDR fall to $17.26 amid waning post-halving hype.
Render (RNDR) Price Prediction 2026
Per Coin Edition’s forecast, diminished enthusiasm could lead RNDR to a dip to $8.526 as the market recalibrates expectations after the previous year’s highs. However, RNDR may witness a high of $16.38 in 2026 as investor sentiment stabilizes post-halving.
Render (RNDR) Price Prediction 2027
In 2027, Coin Edition anticipates RNDR could rally to $26.98, fueled by market optimism ahead of the 2028 Bitcoin halving. However, a potential slowdown could see RNDR testing support at $19.15 if sentiment fades mid-year.
Render (RNDR) Price Prediction 2028
As per Coin Edition, RNDR could reach $43.98 in 2028, benefiting from the bullish momentum associated with the Bitcoin halving. If market corrections emerge, RNDR might revisit $26.84 as investors reassess positions post-halving.
Render (RNDR) Price Prediction 2029
Coin Edition suggests RNDR may reach a new all-time high of $59.23 in 2029, with sustained community support and growing use cases. Conversely, a price retracement could bring RNDR down to $48.60 if market conditions weaken or community interest fades.
Render (RNDR) Price Prediction 2030
According to Coin Edition’s analysis, the RNDR token might retrace from last year’s high and touch $32.51 in 2030. Moreover, if bearish trends persist, a lower low of $19.59 is plausible amid broader market consolidation.
Render (RNDR) Price Prediction 2040
In 2040, Coin Edition forecasts RNDR to reach as high as $105.5, with widespread adoption across industries. In a bearish scenario, RNDR could fall to $92.09 as cyclical market downturns and competition impact demand.
FAQs
Render (RNDR) is the native token of the Render Network, a decentralized platform that connects creators needing GPU rendering power with providers. It facilitates affordable, distributed rendering for high-quality visuals in the creative industry.
To buy RNDR, you can use popular cryptocurrency exchanges like Binance, Coinbase, and Kraken. Simply create an account, deposit funds, and search for RNDR to make a purchase.
Render (RNDR) has shown massive growth potential in the decentralized GPU rendering space. However, as with any cryptocurrency, it carries volatility risks, so investors should conduct thorough research.
RNDR reached an all-time high of $13.60 in March 2024, driven by increased demand in the GPU rendering sector.
Render’s circulating supply is 517.69 million RNDR tokens, with a maximum supply limit of 644.17 million.
According to Coin Edition’s projections, RNDR could surpass its current ATH of $13.60 if bullish trends continue, potentially reaching as high as $59.23 by 2029.
Render’s lowest recorded price was $0.03676 in 2020, showcasing significant growth since then.
Render was founded by Jules Urbach, an innovator in computer graphics and cloud computing, with a vision to create a decentralized network for GPU rendering.
Render (RNDR) was launched in 2017 to provide decentralized solutions to address the high costs and inefficiencies in GPU rendering.
You can store RNDR tokens in compatible crypto wallets such as MetaMask, Trust Wallet, or hardware wallets like Ledger for enhanced security.
Per Coin Edition’s projections, RNDR may reach a high of $14.00 in 2024, driven by potential bullish momentum, with a low estimate of $1.25 if bearish conditions prevail.
According to Coin Edition, RNDR could hit $30.62 in 2025 following the 2024 Bitcoin halving, while a market correction may see it dip to $17.26.
Coin Edition anticipates RNDR could reach $16.38 in 2026 as market sentiment stabilizes, with a possible low of $8.526 due to diminished enthusiasm post-halving.
According to Coin Edition, RNDR may peak at $26.98 in 2027 amid pre-halving market optimism, with a potential support level at $19.15 if sentiment wanes mid-year.
Per Coin Edition, RNDR might reach $43.98 in 2028, spurred by Bitcoin halving-related bullishness. A possible market correction could see it return to $26.84.
In 2029, RNDR could reach an all-time high of $59.23 with strong community backing, while weaker market conditions may pull it back to $48.60, according to Coin Edition.
Coin Edition forecasts RNDR could reach $32.51 in 2030 with industry adoption, but broader market consolidation could lower it to $19.59.
Coin Edition anticipates RNDR reaching $105.5 by 2040 as adoption grows. In a bearish scenario, due to market cycles and competition, it could settle around $92.09.
Disclaimer: The information presented in this article is for informational and educational purposes only. The article does not constitute financial advice or advice of any kind. Coin Edition is not responsible for any losses incurred as a result of the utilization of content, products, or services mentioned. Readers are advised to exercise caution before taking any action related to the company.


