


- XRP displays strong bullish momentum, with prices rising by 10.54% in the past week.
- EGRAG CRYPTO identifies a double bottom pattern, signaling a potential price surge.
- Technical indicators suggest XRP may face resistance at $0.6419 but remain bullish overall.
Ripple’s XRP token has demonstrated significant bullish momentum over the past week, with its price increasing by 10.54%. This trend has continued, with a further 3.04% increase in the last 24 hours, pushing the price of XRP to $0.5487. The optimistic market sentiment is reflected in its market capitalization, which has grown by 2.58% to $30.220 billion.
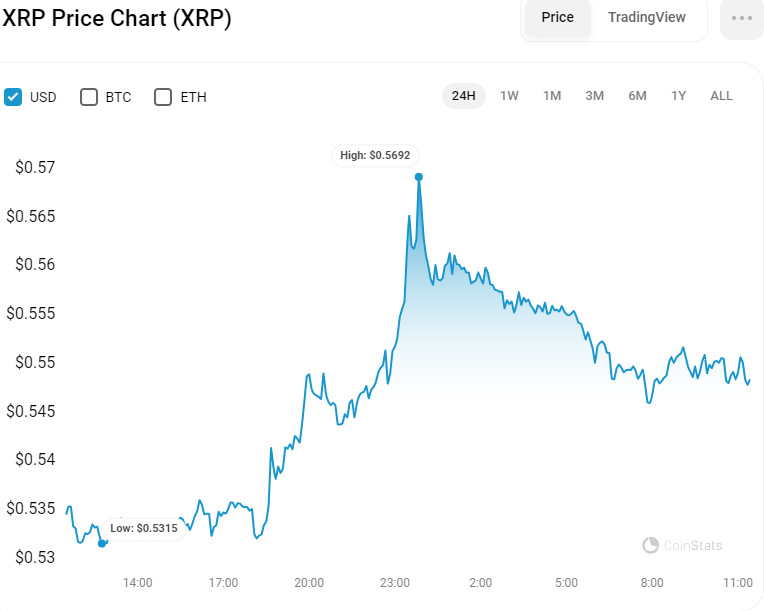
XRP/USD 24-Hour Chart (Source: CoinStats)
Additionally, trading volume has seen a dramatic rise of 43.97% in the last 24 hours, reaching $1.6 billion. This surge in trading volume suggests that investors and traders are increasingly confident about XRP’s potential for further gains, driven by ongoing positive market sentiment.
Analyst Eyes XRP’s Path to $1.4 Amid Technical Shifts
In an update, EGRAG CRYPTO, a recognized voice in cryptocurrency analysis, revealed changes in the technical patterns of Ripple’s XRP token. The analysis notes an update in market behavior, converting what was previously identified as a consolidation zone into a supply zone. Furthermore, the range that experienced wicking has now been classified as a zone of demand and accumulation.
Central to this optimistic outlook is the identification of a double bottom formation on the XRP chart. Traditionally considered a powerful bullish indicator, this pattern has been completed, according to the analyst, who expresses strong confidence in an impending upward movement for XRP.
The double bottom, marked by two distinct troughs at a similar level, is typically followed by a rise in prices, suggesting that investors may soon witness a surge in the value of XRP. According to the tweet from EGRAG CRYPTO, there is an expectation that the XRP token could potentially reach the $1.4 threshold.
XRP/USD Pair Price Analysis
On the one-day chart, XRP’s movement is notable, currently targeting the 61.8% Fibonacci level and encountering resistance beyond. However, at present, it faces some stagnation around the 50% Fibonacci level. Should XRP breach this zone, a move toward the key resistance at $0.6419 is anticipated.
Conversely, failure to break through the 50% Fibonacci level may lead to a potential retracement towards the support level at $0.5278, offering traders an opportunity to reassess positions before the next potential movement.
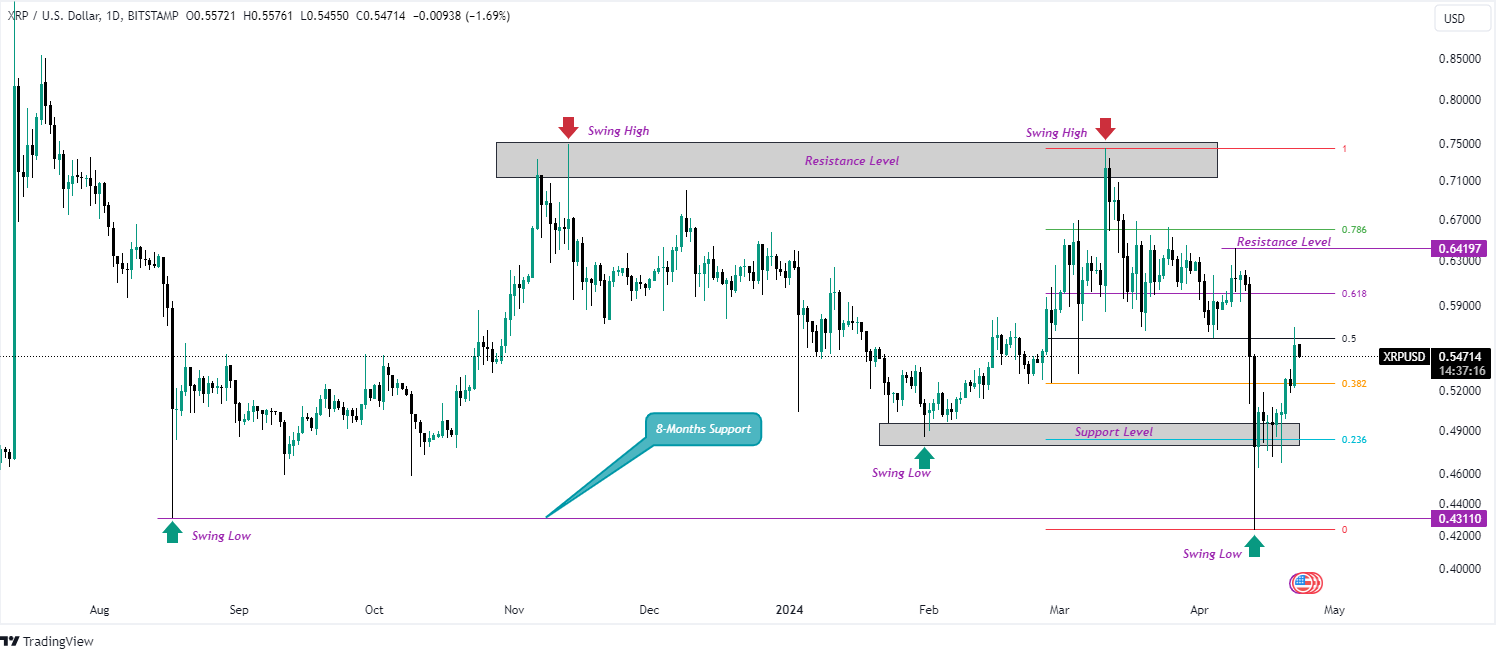
XRP/USD 1-Day Chart (Source: TradingView)
Analyzing the technical indicators, the MACD indicator shows upward movement after crossing over with the signal line in the negative region, indicating bullish momentum in the short term. With the MACD line positioned at 0.020, this suggests building bullish sentiment, reinforced by the histogram bars showing increased size, signifying a strengthening bullish trend.
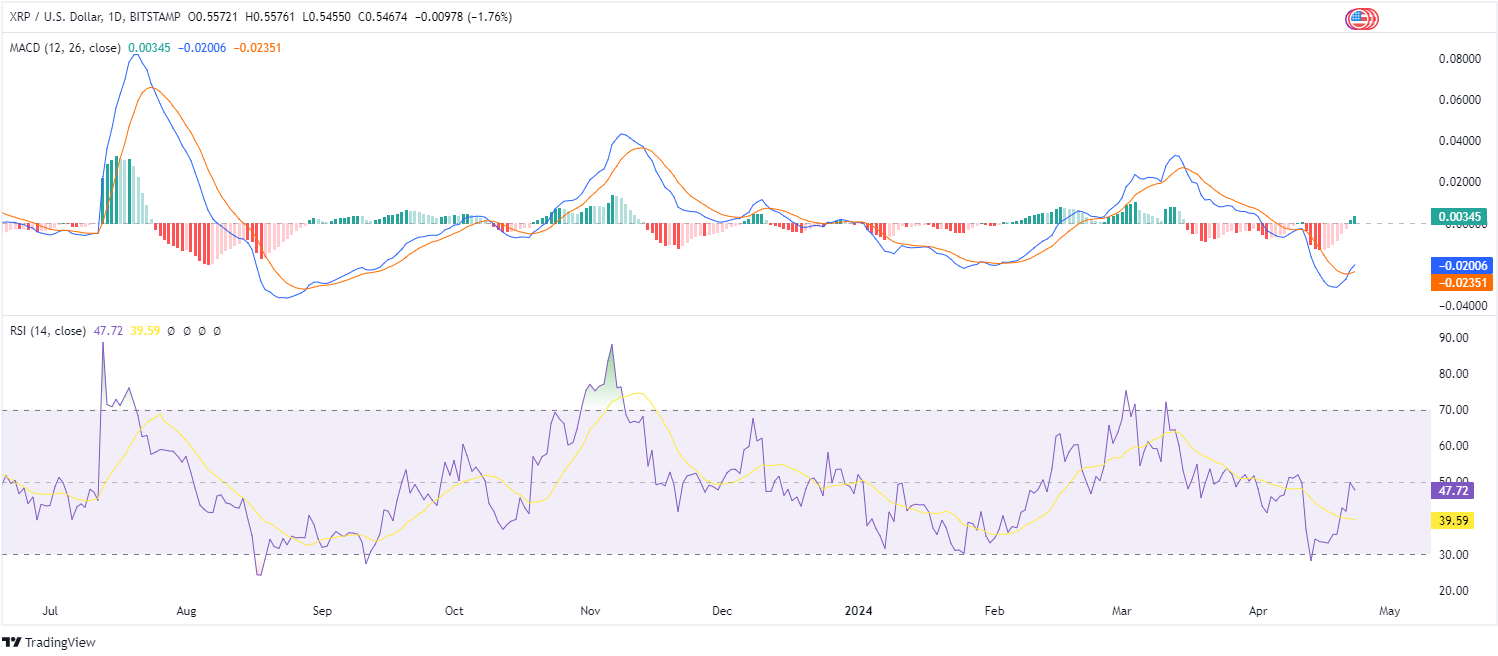
XRP/USD 1-Day Chart (Source: TradingView)
Similarly, the RSI indicates a bullish bias, positioned above the signal line at 47.72. While hovering around the neutral zone, this suggests a neutral condition for XRP in the short term. However, it also hints at the potential for continued upward momentum for XRP in the near future.
Disclaimer: The information presented in this article is for informational and educational purposes only. The article does not constitute financial advice or advice of any kind. Coin Edition is not responsible for any losses incurred as a result of the utilization of content, products, or services mentioned. Readers are advised to exercise caution before taking any action related to the company.


