
The SAHARA price today is trading at $0.081, collapsing more than 75% from its intraday high following its recent listing on Binance. Despite strong exchange exposure, the market reacted with aggressive selloffs, shaking investor confidence and highlighting the high-risk nature of launch-week SAHARA price volatility. At current levels, price is attempting to stabilize around the $0.078–$0.081 support band.
What’s Happening With SAHARA’s Price?
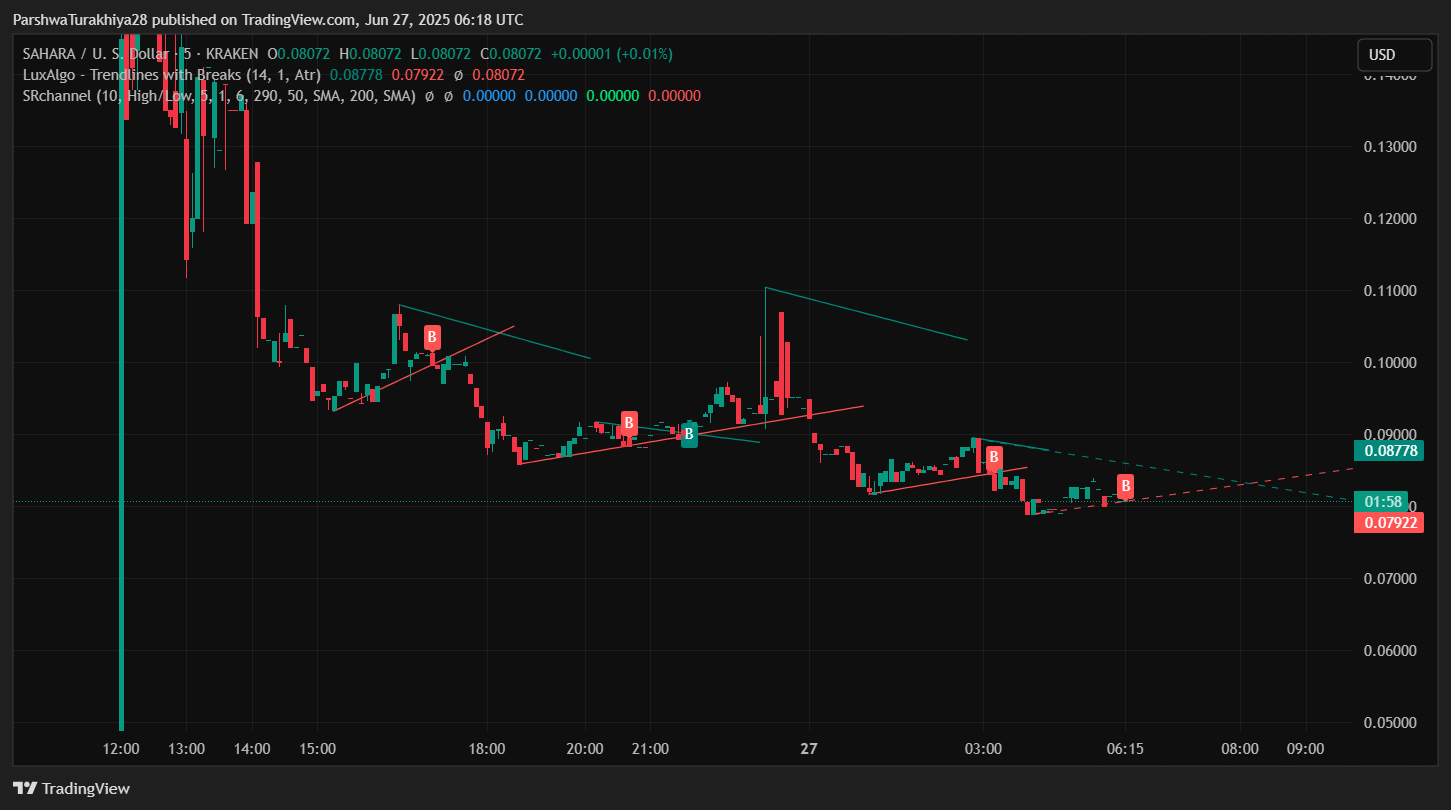
On the 15-minute chart, SAHARA price has been locked in a descending channel since its initial surge to $0.141 on June 26. The most recent leg down formed after the breakout failed near $0.11, triggering back-to-back sell candles. Subsequent attempts to bounce were rejected at $0.088 and $0.090 — confirming a short-term bearish structure.
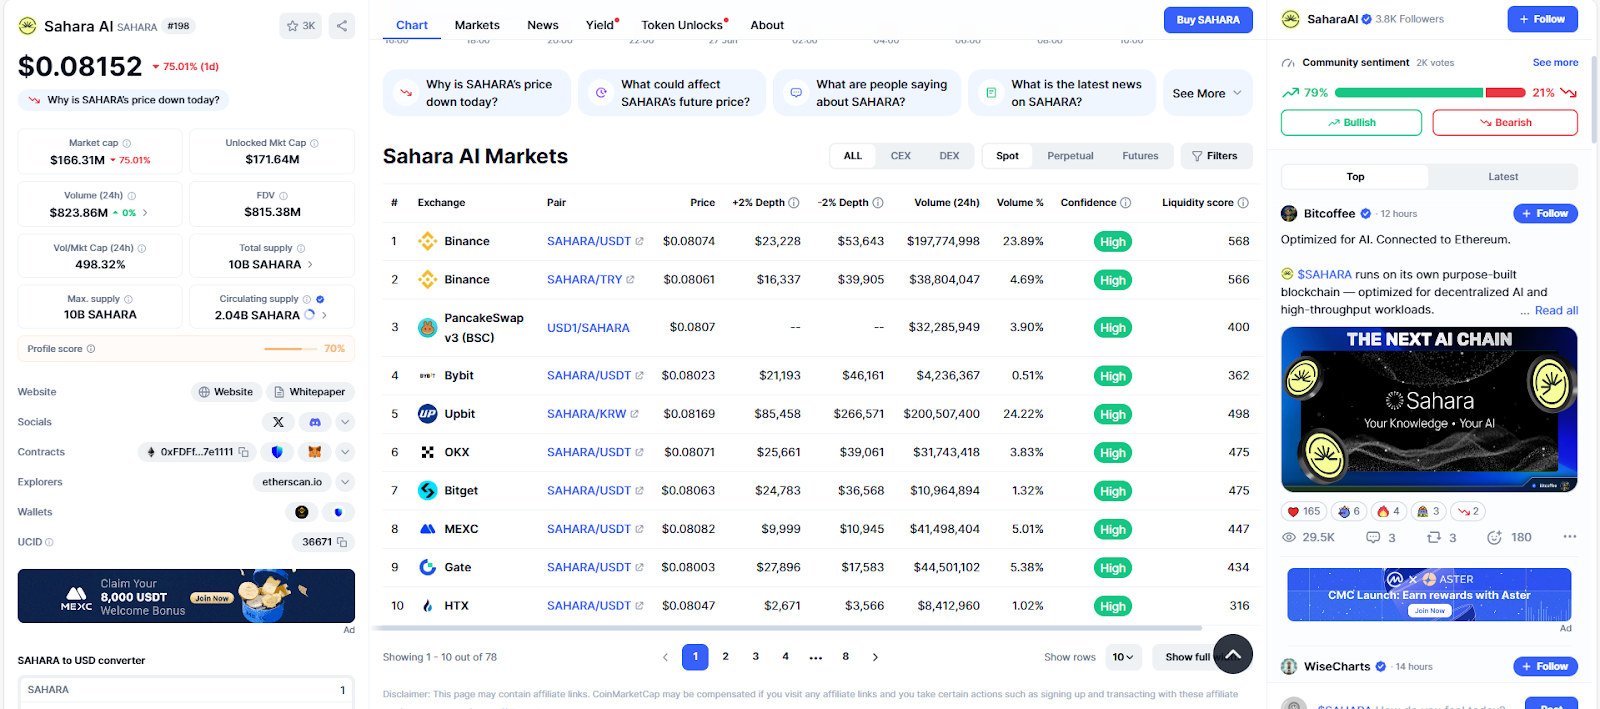
Volume has spiked dramatically across exchanges like Binance and Upbit, with over $800 million traded in 24 hours. Despite this, price action remains weak. The current intraday low at $0.078 aligns with short-term horizontal support from a previous consolidation zone before the Binance listing pump.
On the technical side, repeated “B” signals on LuxAlgo indicate breakout attempts, but the failure to hold those structures suggests short-term holders are actively exiting positions. Any recovery would require a decisive breakout above $0.0878 and confirmation through higher lows.
Why SAHARA Price Going Down Today?
The most critical reason why SAHARA price going down today is the classic post-listing selloff pattern. After Binance listed the token on multiple verticals including Futures and Simple Earn, speculative inflows pushed the price as high as $0.141. However, this was followed by a wave of profit-taking and aggressive shorting activity on margin and futures platforms.
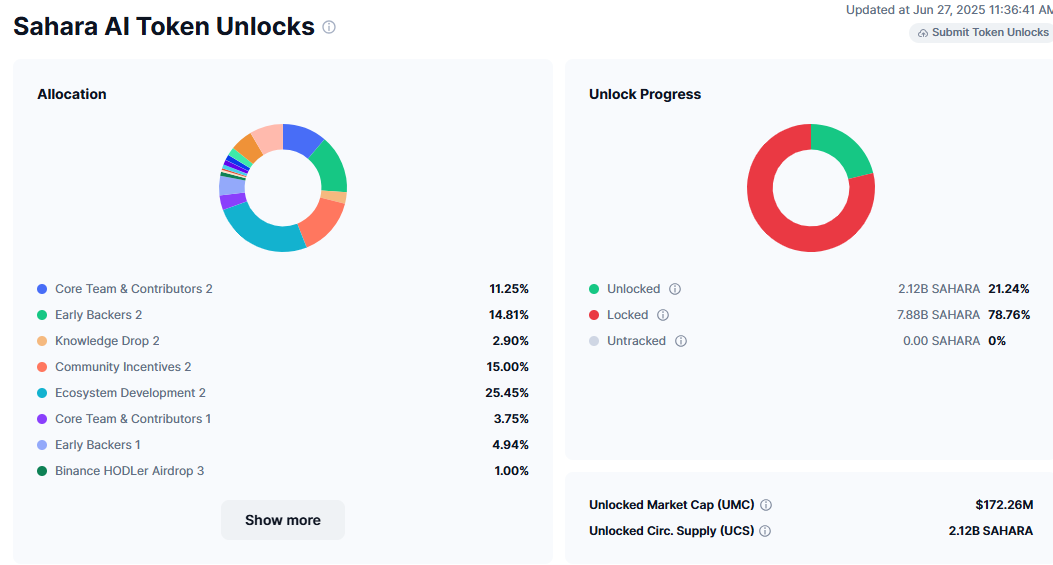
Tokenomics pressure is also weighing heavily on sentiment. According to the latest unlock data, only 21.24% of SAHARA tokens (2.12B) are currently in circulation, while 78.76% remain locked. This unlock ratio raises concerns about future dilution. The unlocked market cap stands at $172.26 million with a total supply of 10B tokens — an overhang that may limit near-term upside.
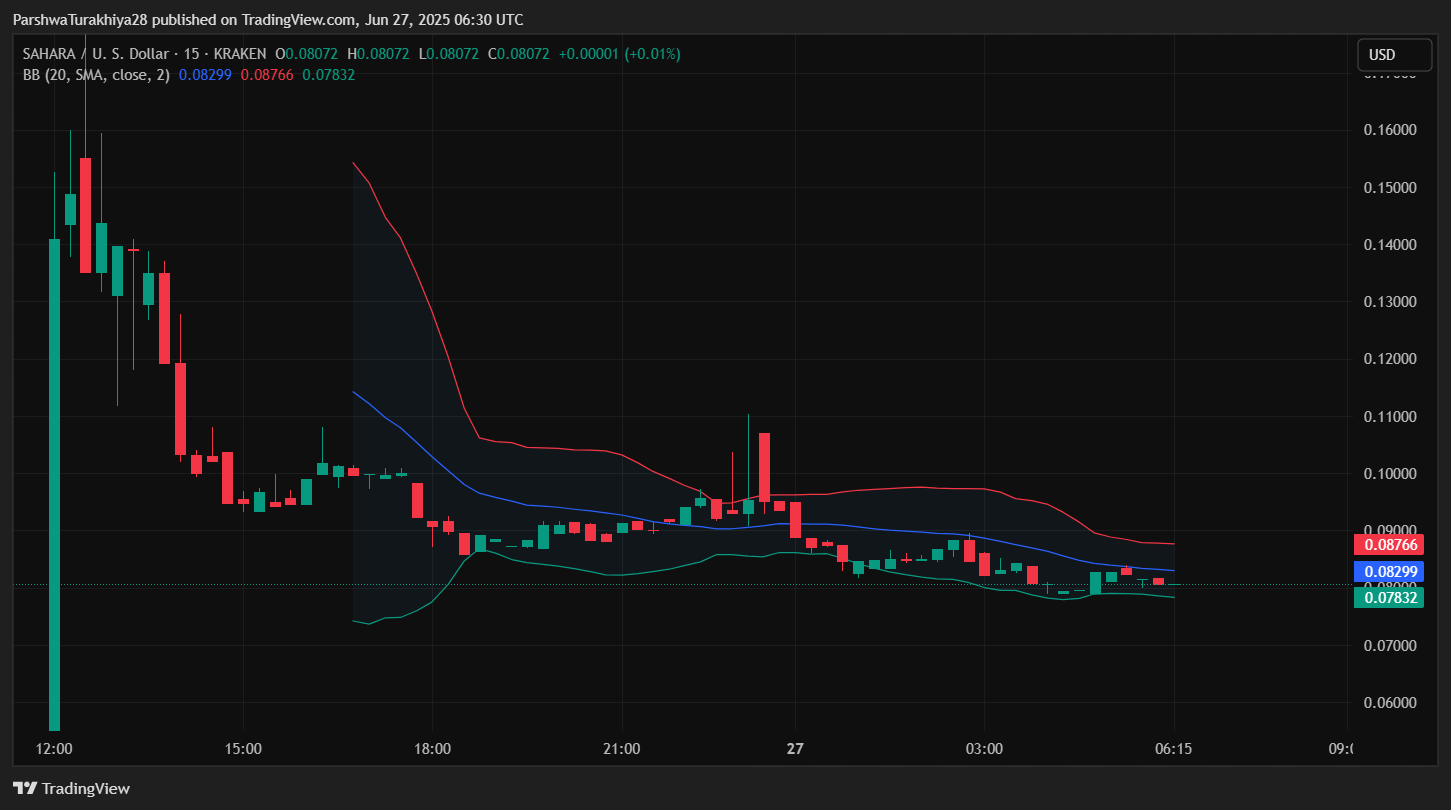
Bollinger Bands on the 15-minute timeframe show price riding the lower band at $0.0783, with mid-band resistance at $0.0829. This alignment typically signals persistent downside momentum. In addition, the upper band remains compressed, suggesting lack of breakout potential.
SAHARA Price Indicators Reflect Weak Momentum and Reversal Risks
Most momentum indicators support the bearish outlook. The price remains below the Bollinger Band basis, while candles fail to close above the mean band. The last attempt at recovery above $0.087 saw immediate rejection, signaling strong overhead resistance.
The Sahara community sentiment dashboard remains 79% bullish, but this has yet to translate into sustained price action. The KRAKEN chart also highlights sloping trendlines acting as dynamic resistance, with buyers unable to hold even modest breakout structures.
From a market structure perspective, SAHARA has formed three lower highs since the listing, and continues to make lower lows. With high volatility and weak fundamentals post-launch, most indicators currently favor the bears.
Additionally, order book data shows the majority of depth clustering around $0.080–$0.083, suggesting that until this zone is flipped into confirmed support, price remains vulnerable to fresh intraday lows.
SAHARA Price Prediction: Short-Term Outlook (24h)
Over the next 24 hours, SAHARA price action is expected to remain volatile with strong directional uncertainty. If the token fails to reclaim $0.088–$0.090, the path remains open for a retest of $0.076 and potentially lower toward $0.072, which would mark a complete retracement of the Binance pump.
On the upside, a breakout above $0.090 would be the first signal of trend reversal, potentially pushing the token back toward $0.10–$0.105 resistance. This would require a sharp increase in volume and a sustained push above the descending wedge resistance on lower timeframes.
With the current unlocked supply over 2B and large institutional allocations still locked, market participants should remain cautious. Short-term speculation may persist, but structural recovery remains elusive without a catalyst.
SAHARA Price Forecast Table: June 28, 2025
| Indicator/Zone | Level (USD) | Signal |
| Resistance 1 | 0.088 | Immediate rejection zone |
| Resistance 2 | 0.090 | Breakout threshold |
| Support 1 | 0.078 | Current intraday support |
| Support 2 | 0.072 | Breakdown continuation zone |
| Bollinger Band Midpoint | 0.0829 | Local resistance |
| Bollinger Band Lower | 0.0783 | Short-term price floor |
| Token Unlock Supply | 2.12B (21%) | Dilution concern remains |
| Daily Volume | $823M+ | Extreme short-term speculation |
| Community Sentiment | 79% Bullish | Mismatch with price structure |
Disclaimer: The information presented in this article is for informational and educational purposes only. The article does not constitute financial advice or advice of any kind. Coin Edition is not responsible for any losses incurred as a result of the utilization of content, products, or services mentioned. Readers are advised to exercise caution before taking any action related to the company.


