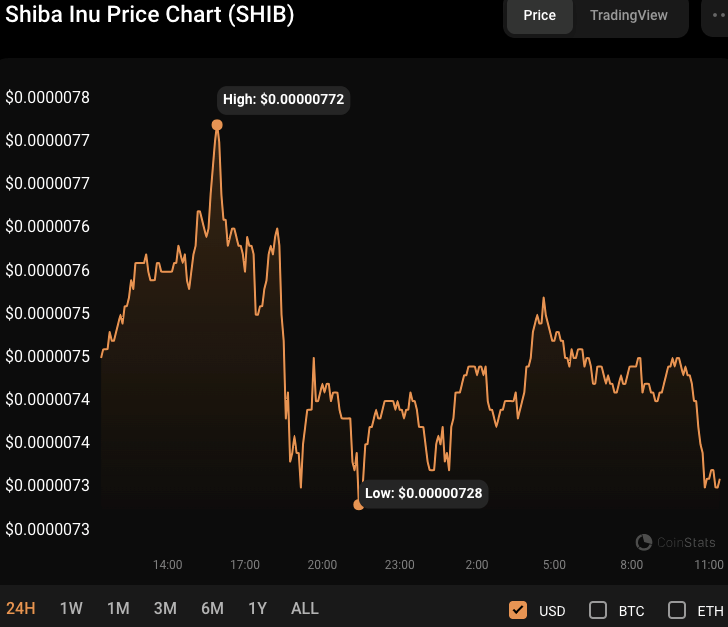
- Shiba Inu price retraces after recording a 30-day high in the last 24 hours.
- Falling market capitalization and trade volume suggest investors are cashing out after a bull run.
- Technical indicators indicate that the market is overbought and a correction is impending.
After hitting a 30-day high of $0.000007697, the Shiba Inu’s (SHIB) bullish momentum stalled, with the price falling to an intra-day low of $0.000007163. However, bulls were able to rally and buck the downward trend, with SHIB trading at $0.000007376.
Despite the brief slump, this price rebound suggests that there is still strong purchasing demand in SHIB. On the other hand, if the support at $0.000007163 is broken, the next support level to watch is $0.000007000. If the bullish trend continues, SHIB might break out over the resistance level of $0.000007500 and continue its upward momentum.
During the spike, the SHIB’s market capitalization and 24-hour trading volume plummeted by 0.03% and 20.97%, respectively, to $4.35 billion and $196.78 million. This dip in market capitalization and trading volume is attributed to profit-taking on the part of investors. Despite the recent drop, however, demand for SHIB among investors has remained robust.

On the SHIBUSD 24-hour price chart, the Bollinger bands are moving linearly, with the upper and lower bands touching $0.00000746 and $0.00000663, respectively, indicating that the price of SHIB is now in a consolidation phase.
This pattern implies that the market is in a period of stability and that significant price fluctuations are unlikely soon. Furthermore, the Relative Strength Index (RSI) rating currently stands at 50, supporting the consolidation period by indicating that the market is balanced with equal buying and selling pressure.
The RSI trending south, on the other hand, signals a potential change in momentum toward selling pressure, which might lead to a breakout from the consolidation phase and a probable negative movement in the price of SHIB soon.
With a reading of 88.45, the stochastic RSI has fallen below its signal line, adding a bearish divergence to the current price trend. This change signals that the SHIB market may see a short-term correction as traders begin to take gains. This pattern is bolstered further by falling trade volume, suggesting a likely decline in market activity.
If the stochastic RSI continues to fall and falls below the oversold level of 20, the price of SHIB may fall further. However, if purchasing demand continues high and traders maintain their positions, the price drop may be brief and followed by a possible comeback.
The Money Flow Index (MFI) of 76.91 indicates that there is still strong purchasing demand in the market for SHIB. This pattern may support a positive perspective and signal that the price drop is transitory. However, if the MFI reading begins to fall and moves into an oversold area, it might suggest a change in market sentiment and a likely continuation of the SHIB’s price decrease.
In conclusion, SHIB’s recent price dip hints at potential volatility ahead, but strong demand and technical indicators suggest a possible rebound.
Disclaimer: The information presented in this article is for informational and educational purposes only. The article does not constitute financial advice or advice of any kind. Coin Edition is not responsible for any losses incurred as a result of the utilization of content, products, or services mentioned. Readers are advised to exercise caution before taking any action related to the company.


