 Price Prediction For July 16")
After posting a strong early July recovery, Shiba Inu price has pulled back toward a key demand zone as sellers attempt to halt the latest rally. With symmetrical triangle compression and key resistance levels overhead, traders are eyeing a potential breakout or rejection in the coming days.
Shiba Inu Price Forecast Table: July 16 2025
| Indicator/Zone | Level / Signal |
| Shiba Inu price today | $0.00001296 |
| Resistance 1 | $0.00001404 |
| Resistance 2 | $0.00001508 |
| Support 1 | $0.00001200 |
| Support 2 | $0.00001044 |
| EMA Cluster (20/50/100/200, 4H) | $0.00001320 / $0.00001284 / $0.00001244 / $0.00001232 |
| RSI (30-min) | 40.83 (Bearish-leaning neutral) |
| MACD (30-min) | Weak crossover below signal line |
| Bollinger Bands (4H) | Compression, retesting lower band |
| Smart Money BOS/CHoCH | Key CHoCH near $0.00001197 |
| Netflow (On-chain, July 15) | -$146.34K (Bearish outflow) |
What’s Happening With Shiba Inu’s Price?
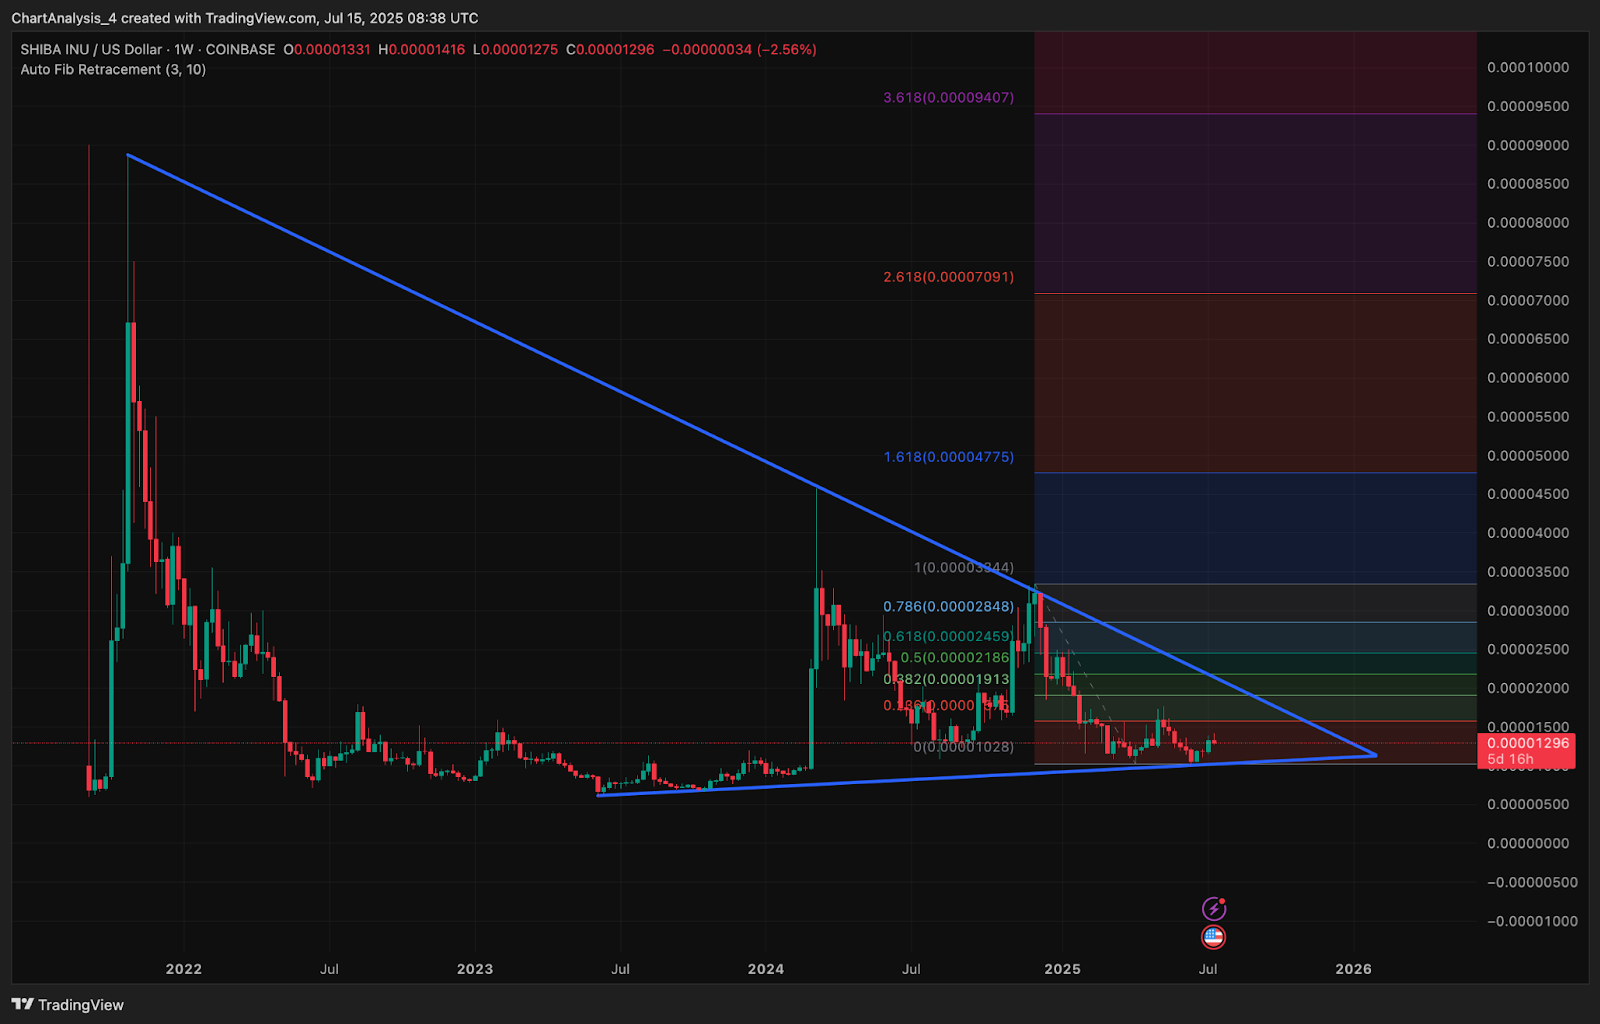
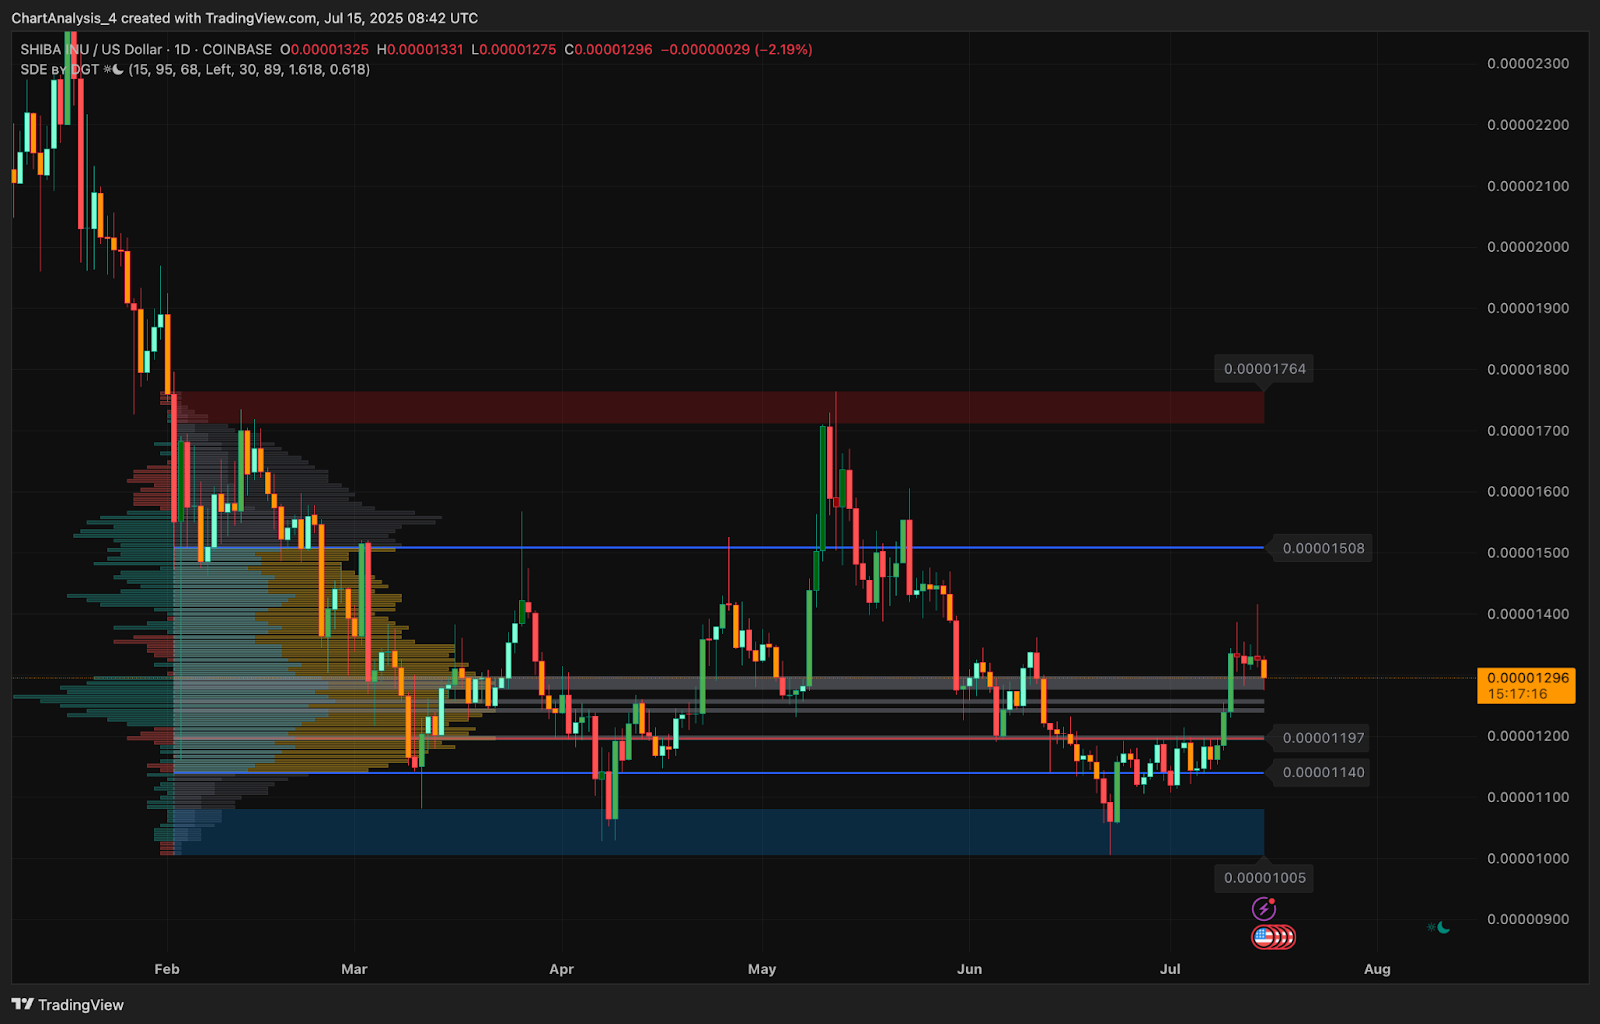
On the weekly chart, SHIB continues to trade inside a multi-year symmetrical triangle formation. The upper trendline near $0.00001764 has remained a consistent ceiling since early 2022, while the lower boundary near $0.00001028 has formed a base of support. Price is currently consolidating just above $0.00001290, attempting to build higher lows within this structure.
The weekly Fibonacci retracement shows that SHIB remains well below the 0.618 retracement level ($0.00002459), with upside targets at $0.00003444 (Fib 1.0) and $0.00004775 (1.618 extension). As long as SHIB holds above the triangle base, this coiling action suggests an eventual volatility breakout.
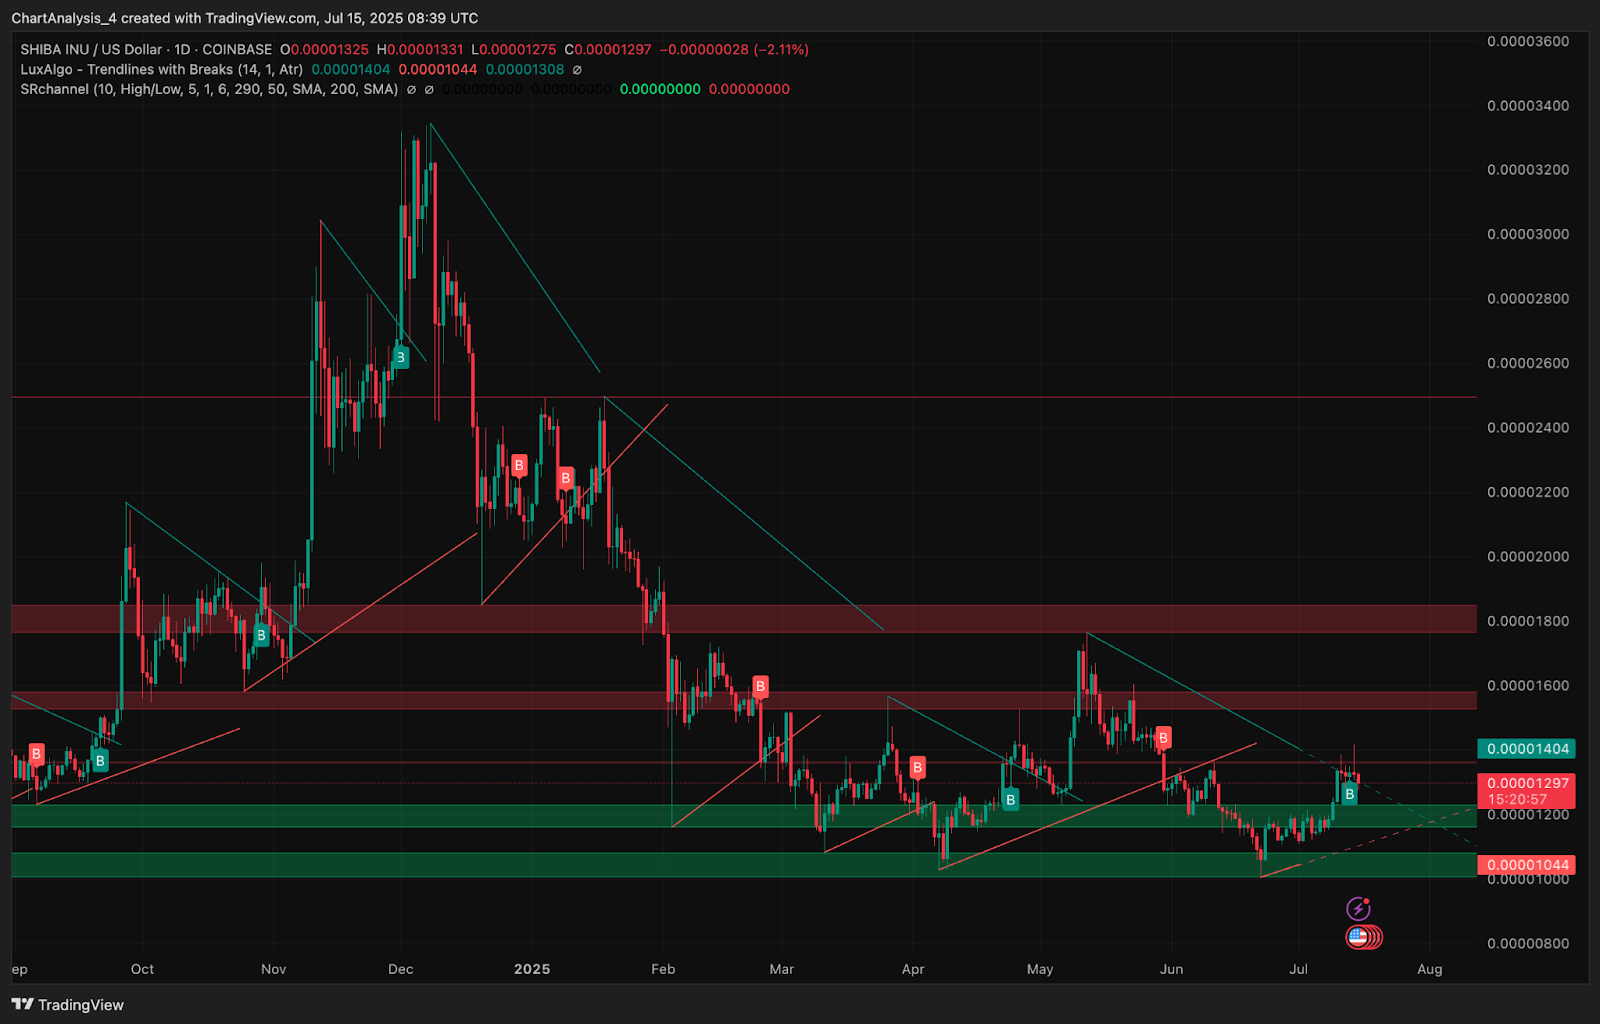
On the daily chart, Shiba Inu price action is showing signs of seller exhaustion just above the $0.00001197–$0.00001200 support cluster. The recent rally stalled at the $0.00001404 level, aligning with a horizontal resistance block and the upper trendline of a descending channel. Price is now retesting the channel breakout zone, with the green demand region from $0.00001140 to $0.00001044 acting as a critical support range.
Why Shiba Inu Price Going Down Today?
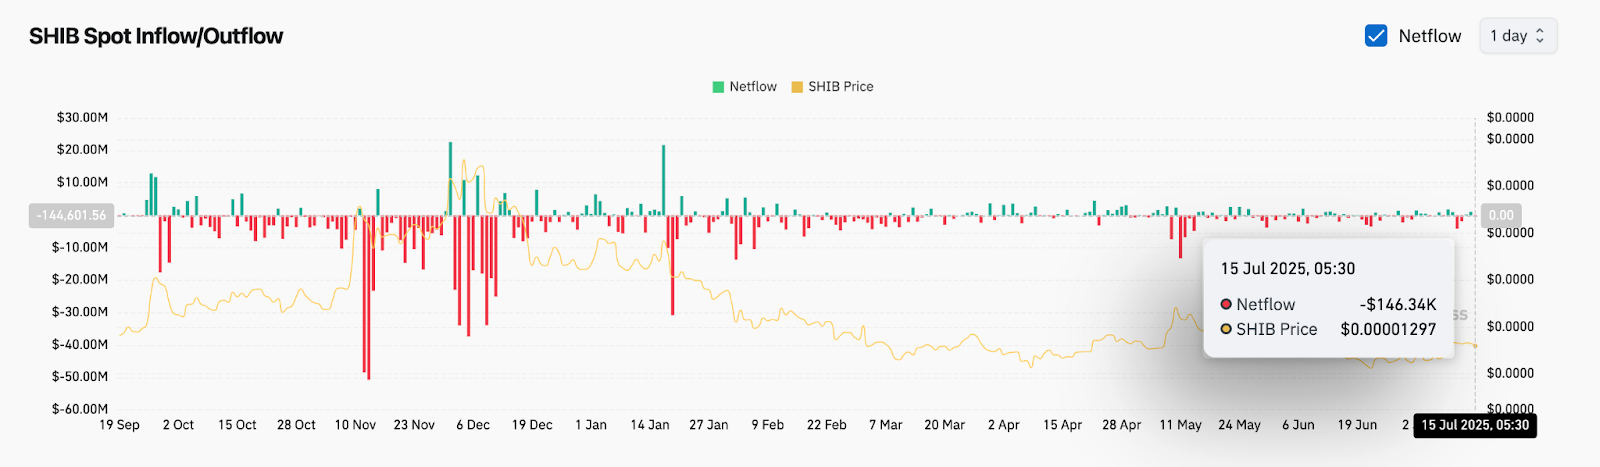
The intraday decline in Shiba Inu price today can be linked to both technical and behavioral signals. On-chain netflow data for July 15 shows an outflow of over $146K, highlighting a bearish sentiment among larger holders and reinforcing the intraday weakness.
From a short-term technical view, the 30-minute RSI has slipped to 40.83, indicating bearish momentum and cooling strength. Meanwhile, MACD remains below the signal line, suggesting a continuation of minor downside pressure unless bulls reclaim intraday control.
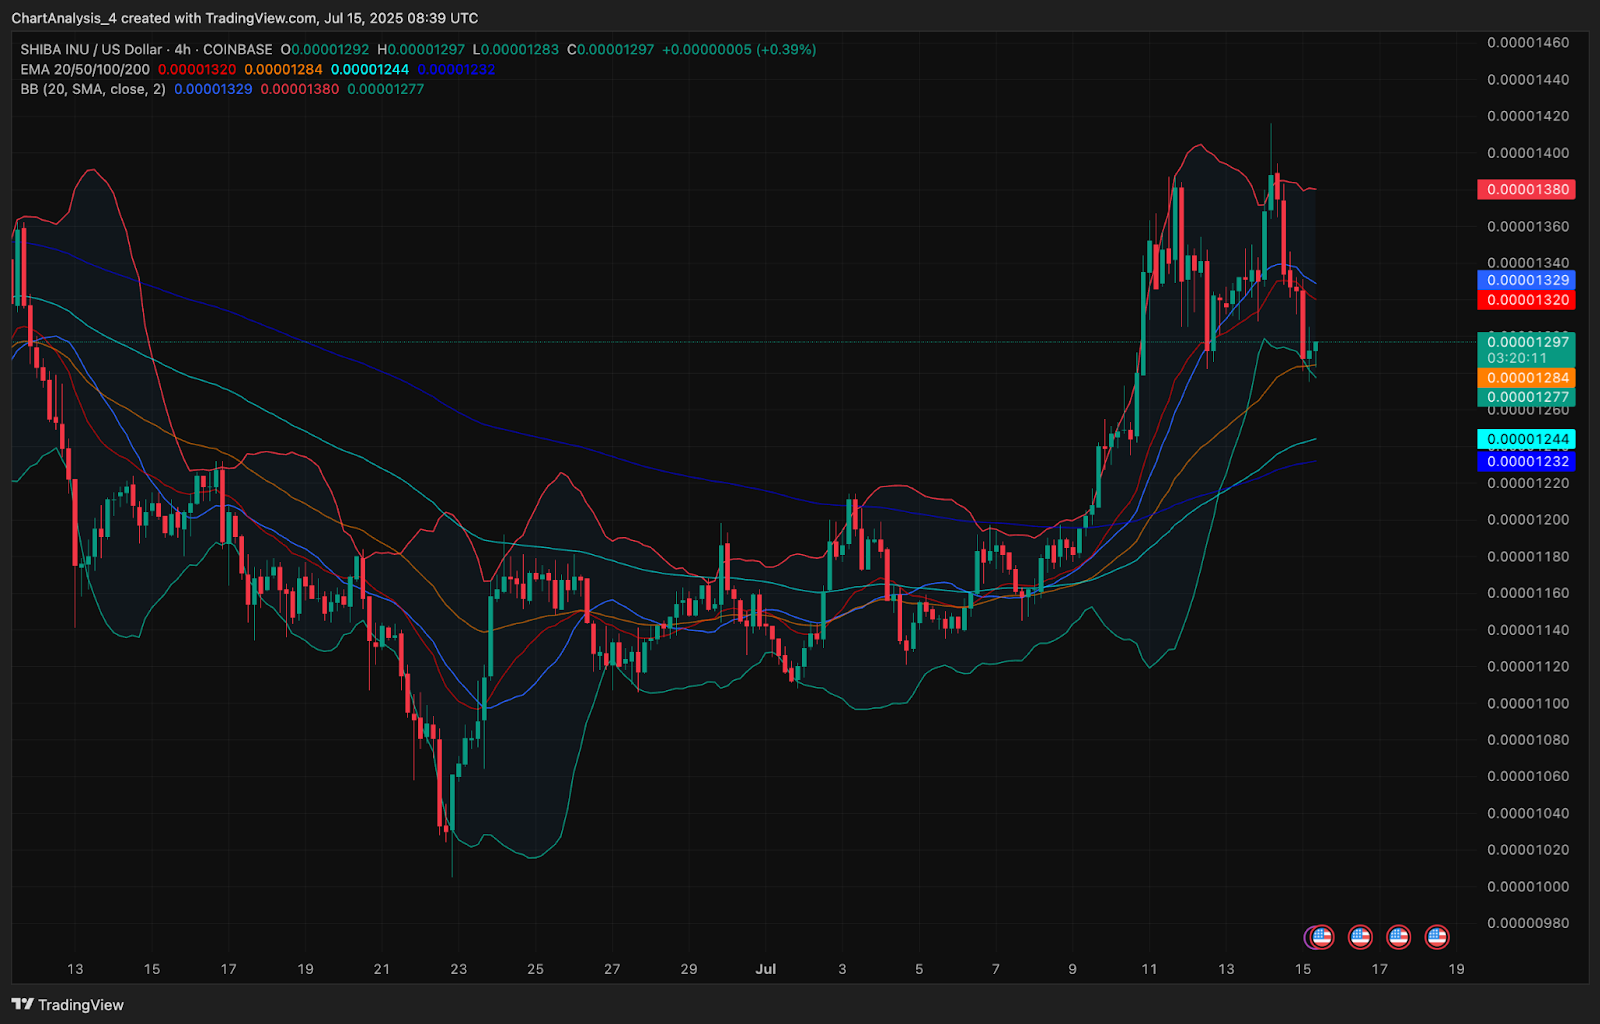
On the 4-hour chart, SHIB is battling near the lower Bollinger Band at $0.00001277, while price hovers around the 20 EMA ($0.00001320). Bollinger Band compression over the weekend preceded the recent spike, and the current reversion toward the mean could present a short-term accumulation opportunity if bulls defend the midline.
The recent change-of-character (CHoCH) and break-of-structure (BOS) signals around $0.00001197 and $0.00001400 further reinforce the idea that SHIB is in a liquidity-seeking consolidation, rather than a trend reversal.
SHIB Price Action Reflects Volatility Compression And Liquidity Zones
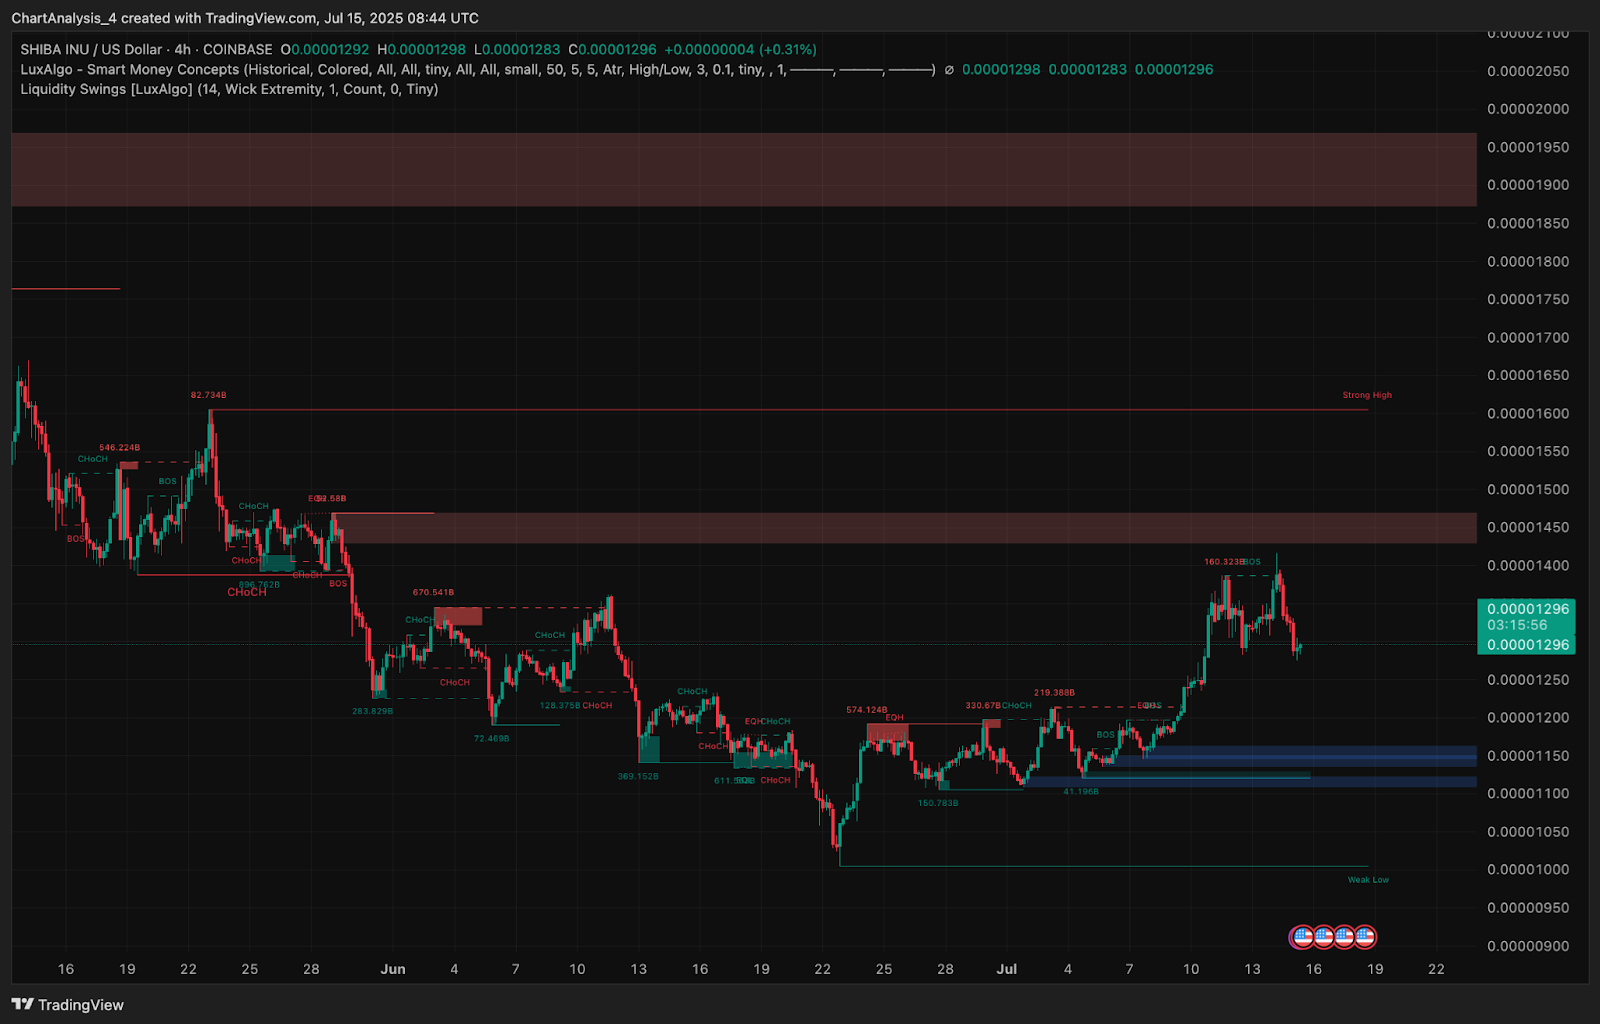
Price structure on the Smart Money Concept chart shows that Shiba Inu price remains beneath a key liquidity pocket near $0.00001508, with rejection occurring as price swept local highs around $0.00001430. The strong supply area between $0.00001500 and $0.00001760 continues to act as resistance for upward momentum.
Below, the volume profile shows notable support near $0.00001140 and again at $0.00001005 — levels that historically triggered strong bullish reactions. These zones could offer demand-side defense if selling continues.
On the 4-hour RSI and MACD combo, momentum remains neutral-bearish but shows early signs of curling higher. RSI is recovering from oversold conditions, while the MACD histogram is flattening near zero — indicating a potential pivot setup if price stabilizes above $0.00001270.
SHIB Price Prediction: Short-Term Outlook (24h)
In the next 24 hours, Shiba Inu price may trade between $0.00001240 and $0.00001380 as it tests the resilience of both intraday buyers and short-term holders. If SHIB holds above the $0.00001244 100 EMA and reclaims $0.00001320, bullish momentum could resume with upside targets at $0.00001404 and then $0.00001508.
Conversely, failure to hold above $0.00001200 may trigger a deeper pullback toward $0.00001140 and potentially $0.00001044, which aligns with the lower end of the current demand zone and the broader triangle structure.
Given the narrowing volatility bands, Fibonacci compression, and declining on-chain inflows, traders should closely monitor the $0.00001200–$0.00001300 area for the next breakout signal.
Disclaimer: The information presented in this article is for informational and educational purposes only. The article does not constitute financial advice or advice of any kind. Coin Edition is not responsible for any losses incurred as a result of the utilization of content, products, or services mentioned. Readers are advised to exercise caution before taking any action related to the company.


