


- SOL bulls soar 24.49% in 30 days, eyes $25 target amidst rising market interest.
- Golden cross signals SOL/USD uptrend, but RSI warns of overbought conditions.
- Solana’s TVL hits record high, signaling growing confidence in the blockchain network.
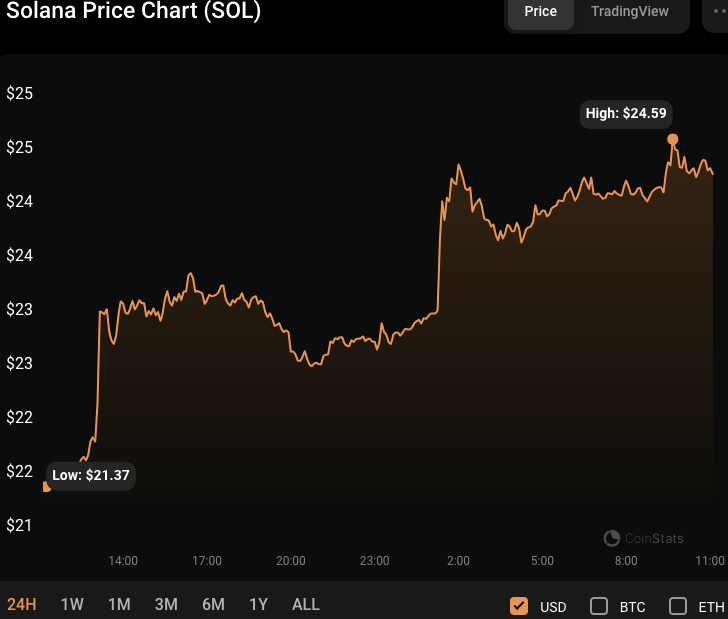
In the previous 24 hours, the Solana (SOL) market has seen a bullish surge, with bulls surging from an intraday low of $21.38 to a 4-week high of $24.60 before hitting resistance. Despite the opposition, SOL traded at $24.37 at press time, representing a 24.49% increase in the past 30 days.
During the bull run, SOL’s market capitalization and 24-hour trading volume increased by 13.68% and 131.52%, respectively, to $10,041,703,919 and $796,963,636. Furthermore, the total value secured on the Solana blockchain has risen to a record high of $338.82 million in 2023. As of press time, SOL’s Total Value Locked (TVL) has increased by about 4.25% in 24 hours, rising from $324.64 million to $338.82 million.
This increase reflects increased interest in and acceptance of the Solana blockchain as more users secure their valuables on the network. The market capitalization and trade volume growth also imply that SOL tokens are in high demand, contributing to their price rise.
If bulls break the $24.60 resistance, the next target to monitor is $25 and $25.50, which might operate as major psychological hurdles for the price of SOL which if overcome, could lead to more upward momentum. If bulls, however, fail to break through the $24.60 resistance, a reversal to the $23.50 support level is probable.
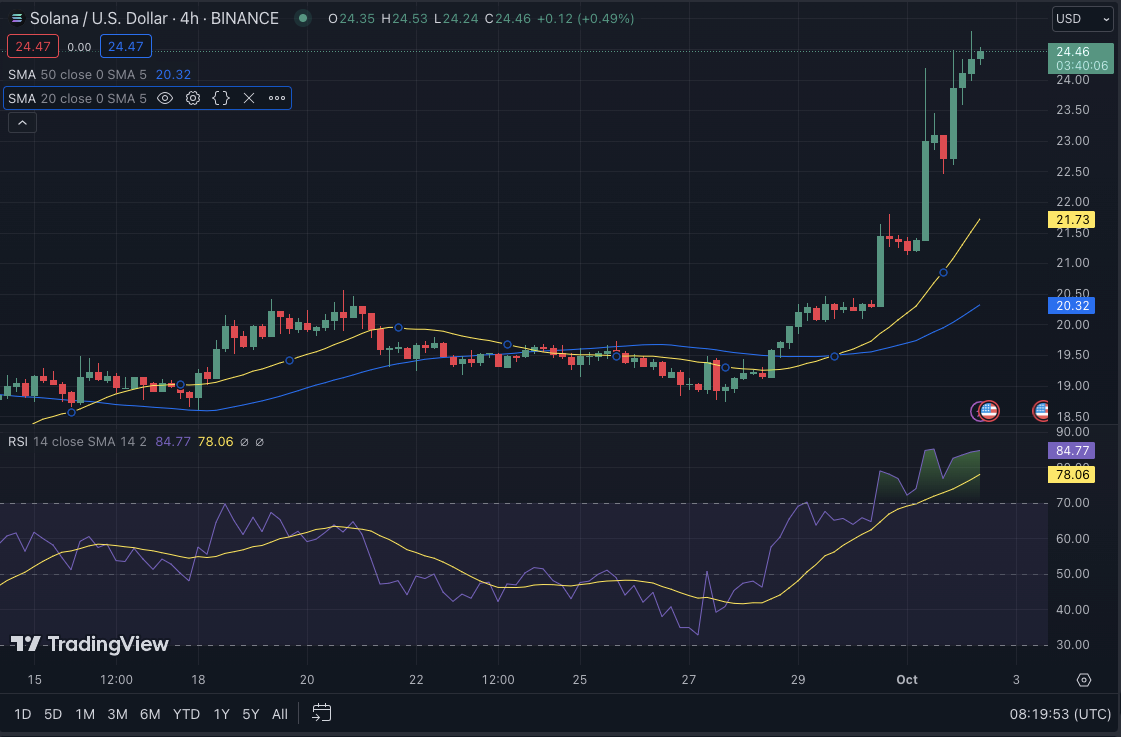
SOL/USD Technical Analysis
On the SOL/USD 4-hour price chart, the 20-day moving average (yellow) has crossed above the 50-day moving average (blue), indicating the appearance of a positive signal. This crossing signals a likely rising trend in the price of SOL/USD since the shorter-term moving average has exceeded the longer-term moving average.
This golden cross is often seen as a positive indicator by traders and may increase purchasing activity in SOL/USD. With the former at 21.72 and the latter at 20.32, the positive feeling in the SOL market is clear.
The Relative Strength Index (RSI) of 84.70, on the other hand, implies that the SOL/USD pair is overbought and ripe for a possible drop. This degree of overboughtness suggests that the SOL/USD price may be unsustainable in the immediate run. If the RSI rating stays high or continues to rise, it may suggest that the market is getting more speculative and vulnerable to a sell-off.
In conclusion, Solana’s bullish surge signals strong demand, but the overbought RSI suggests caution as it approaches resistance at $24.60.
Disclaimer: The views, opinions, and information shared in this price prediction are published in good faith. Readers must do their research and due diligence. Any action taken by the reader is strictly at their own risk. Coin Edition and its affiliates will not be liable for direct or indirect damage or loss.
Disclaimer: The information presented in this article is for informational and educational purposes only. The article does not constitute financial advice or advice of any kind. Coin Edition is not responsible for any losses incurred as a result of the utilization of content, products, or services mentioned. Readers are advised to exercise caution before taking any action related to the company.


