- Lookonchain shared today that FTX deposited SOL worth more than $13 million to Kraken.
- Over the past 24 hours, SOL’s price slipped by more than 6%, which left it trading hands at $54.42.
- Technicals on SOL’s daily chart suggest that the altcoin’s price could continue to drop in the coming days.
Earlier today, the on-chain analytics platform Lookonchain shared in an X (formerly Twitter) post that FTX has deposited 250K Solana (SOL) to Kraken. The deposited SOL tokens were worth about $13.6 million, according to the post.
Lookonchain also added in the post that FTX now only has an estimated 3,408 SOL tokens, worth $185K, left. Meanwhile, SOL ranked as a trending token on CoinMarketCap today, but certainly not for the reasons many traders may have been hoping for.
FTX’s SOL transfer was likely behind the altcoin’s more than 6% price drop recorded over the past 24 hours of trading. At press time, the Ethereum-killer was worth $54.42 after it reached a daily low price of $51.71.
The decline in SOL’s price also caused it to weaken against the market leader, Bitcoin (BTC), by about 5.60%. Meanwhile, SOL’s 24-hour trading volume settled at $2,972,114,219 at press time after it experienced a more than 21% jump since yesterday, likely due to holders selling their tokens.
It is worth noting, however, that SOL’s weekly performance was still up by 31.14%. The token’s monthly performance was luckily still firmly rooted in the green zone at +147.87%.
Throughout the past day, the altcoin’s market cap dropped to $23,346,620,006, which ranked SOL as the 7th largest token by market cap. This placed SOL behind USDC, with Cardano (ADA) on its heels.

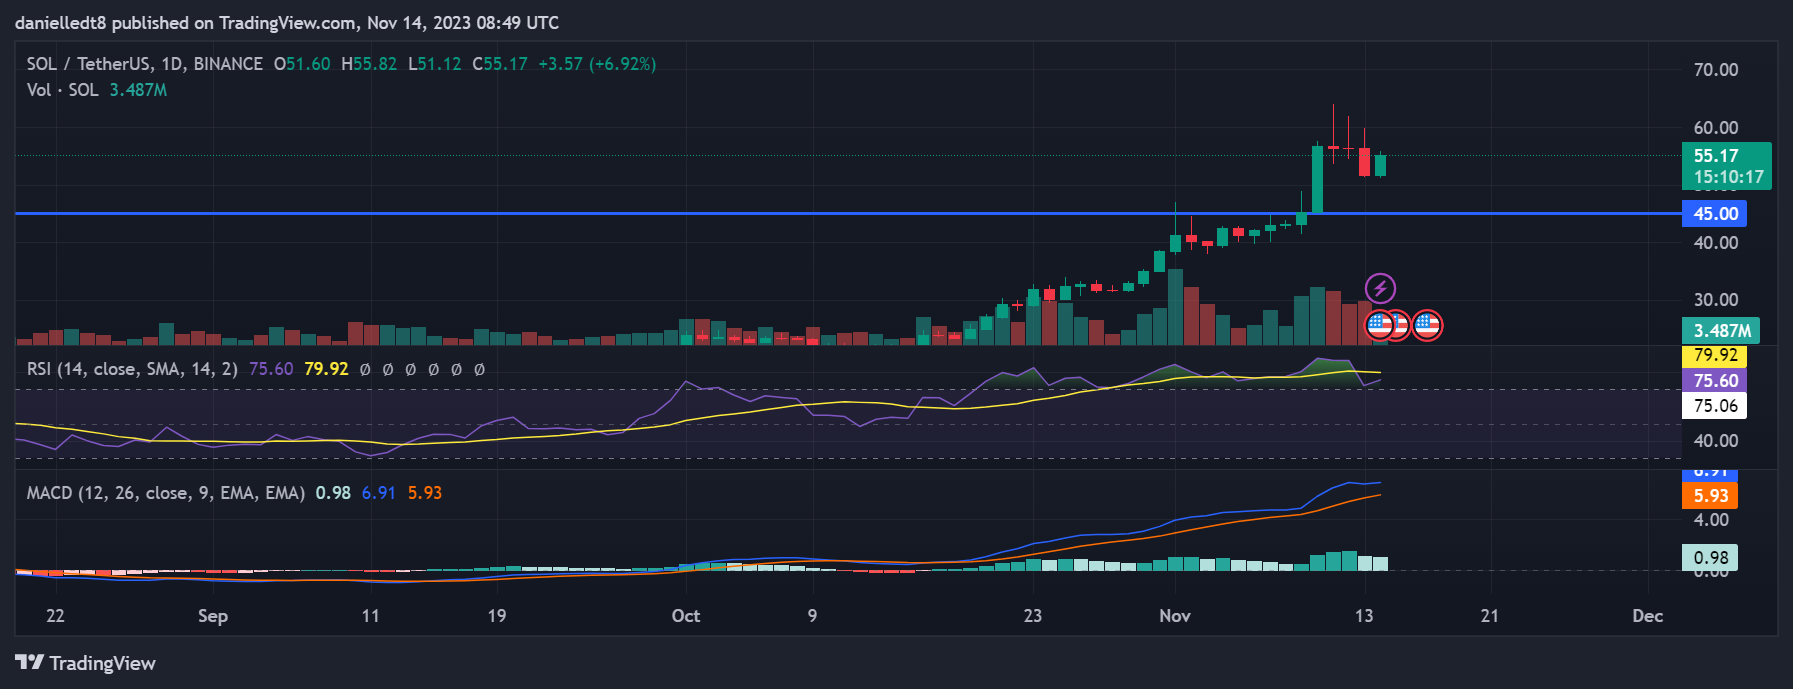
Daily chart for SOL/USDT (Source: TradingView)
The daily Moving Average Convergence Divergence (MACD) and Relative Strength Index (RSI) indicators suggested that SOL’s price may continue to drop in the next 24-48 hours. At press time, the MACD line was closing in on the MACD Signal line, which may indicate a continuation of SOL’s negative trend in the next few days.
Meanwhile, the RSI line had crossed below the RSI Simple Moving Average (SMA) line over the past 3 days. This suggests that sellers had gained the upper hand against bulls on SOL’s daily chart. Should these technical flags be validated, SOL may drop to $45.
Disclaimer: The information presented in this article is for informational and educational purposes only. The article does not constitute financial advice or advice of any kind. Coin Edition is not responsible for any losses incurred as a result of the utilization of content, products, or services mentioned. Readers are advised to exercise caution before taking any action related to the company.


