

- Tuesday’s sweep below $117.26 recovered above Monday’s low and brought $118.89 into focus.
- Holding $118.89 keeps $122.93 as the first upside target, with $124.13 above it.
- U.S. spot Solana ETFs have accumulated 4.37M SOL worth about $450M since July 13.
Tuesday’s sweep below $117.26 and quick recovery have shifted focus to the $118.89 confirmation level before Solana can challenge $122.93 and $124.13. The move suggests a potential liquidity grab rather than a breakdown, placing the reclaimed range at the center of the next directional test.
| Chart Price | Tuesday Signal | CISD Trigger | Upside Reference |
| $119.13 | Potential sell-side sweep | $118.89 | $124.13 |
Tuesday Range Reclaim Puts $124.13 Liquidity in Focus
Solana traded near $119.13 on the supplied one-hour chart after Tuesday moved below Monday’s $117.26 low and then recovered. Monday’s range extends from $117.26 to $122.93. Consequently, Tuesday’s move beneath that boundary created the key liquidity event.
The decline reached the marked $116.45 order block before the price rebounded above Monday’s low. That sequence represents a potential sell-side liquidity sweep rather than sustained acceptance below the previous range.
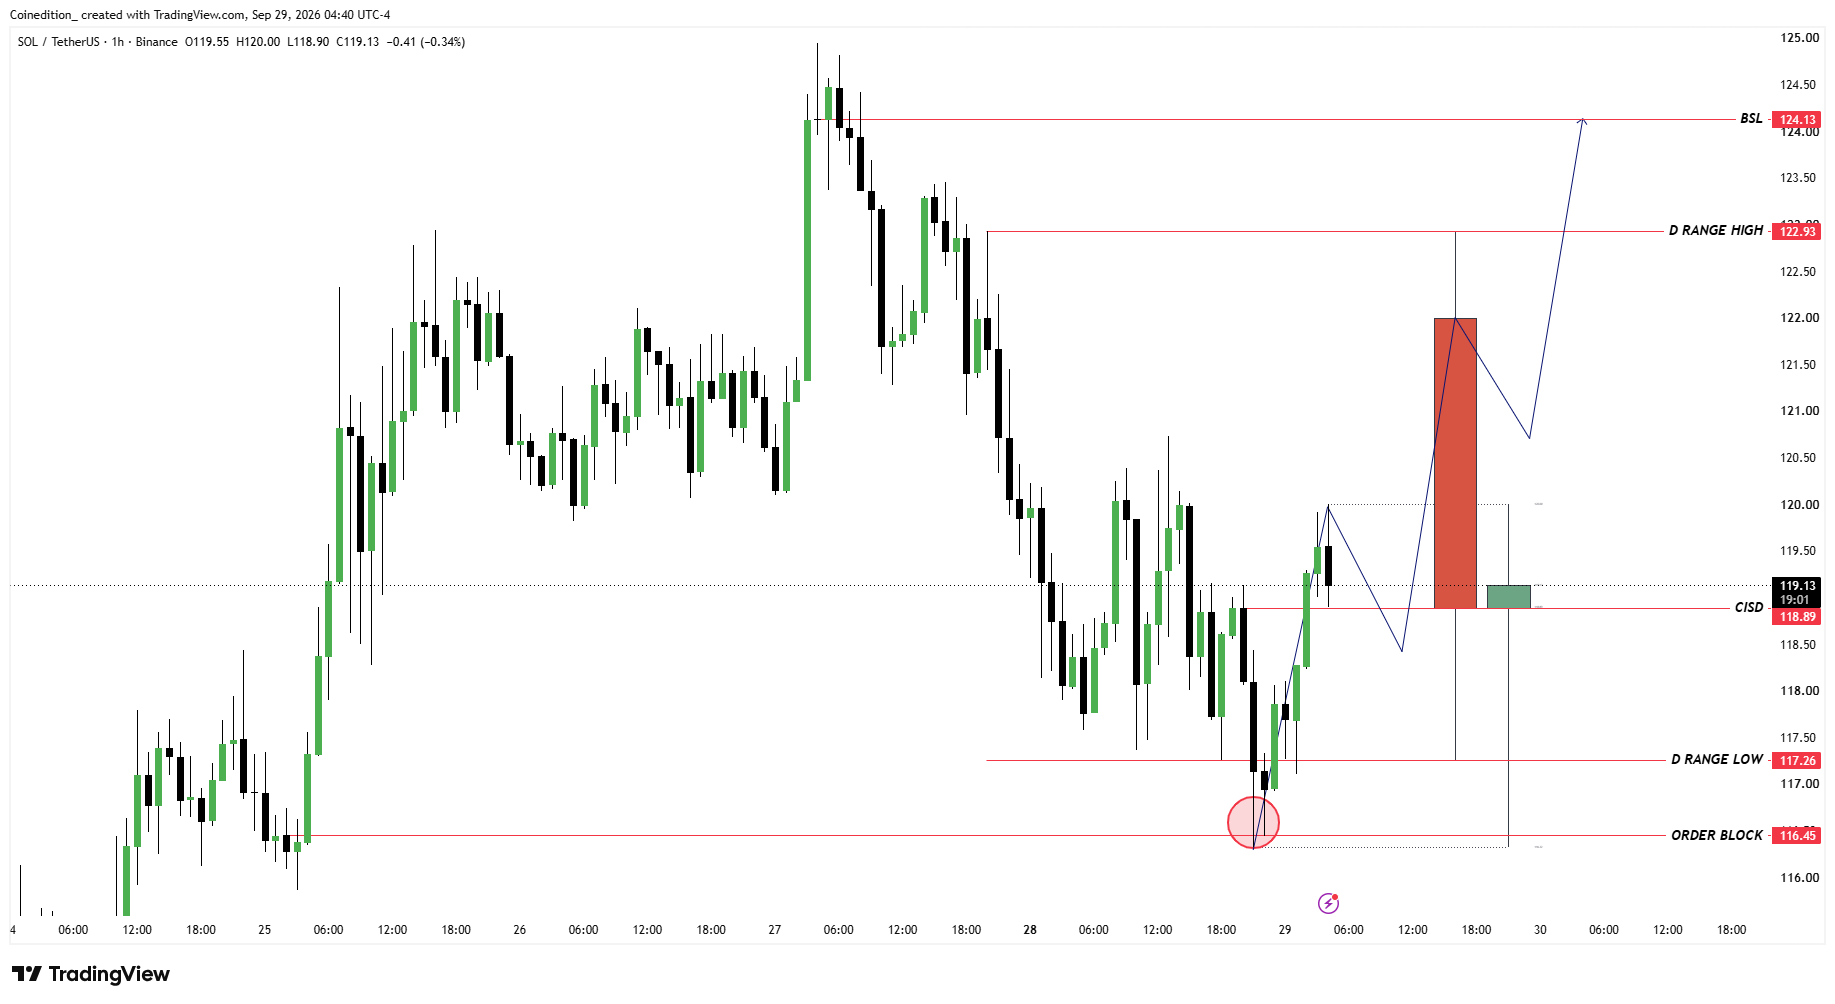
However, recovering $117.26 completes only the first part of the setup. The chart places the CISD trigger at approximately $118.89. Holding that level would provide confirmation rather than anticipation. At press time, SOL’s price was slightly above $118.89 in the supplied snapshot, making Tuesday’s close the next key test.
$118.89 CISD Confirmation Sets Up the $122.93 Test
A Tuesday close inside Monday’s range would preserve the proposed manipulation structure and keep the opposite side of the range in focus. At the same time, continued acceptance above $118.89 would strengthen the recovery and confirm that buyers are maintaining control above the CISD level.
However, a move above the CISD followed by rejection would weaken the sequence. Once the reclaim is confirmed, Monday’s $122.93 high becomes the first major upside draw. From $119.13, reaching that level would require an advance of approximately 3.2%.
Therefore, if Tuesday closes inside the range while $118.89 remains defended, the mapped rotation could extend toward $122.93 by Wednesday. Conversely, a sustained move below $118.89 would weaken the reclaim, while a break below $117.26 would shift attention back toward the $116.45 order block.
$122.93 Break Exposes $124.13 Buy-Side Liquidity
If the recovery continues, Monday’s $122.93 high becomes the next major hurdle before the higher liquidity target comes into view. The $124.13 buy-side liquidity sits above that level, making it the secondary objective.
The SOL price would therefore need to rotate through Monday’s range and clear its upper boundary first. From the chart price of $119.13, a move to $124.13 represents an advance of roughly 4.2%. As a result, the mapped sequence progresses from $118.89 to $122.93 and then to $124.13.
However, that final stage still depends on bullish momentum holding after Monday’s high is cleared. Meanwhile, the technical structure is developing alongside continued accumulation through U.S. spot Solana ETFs.
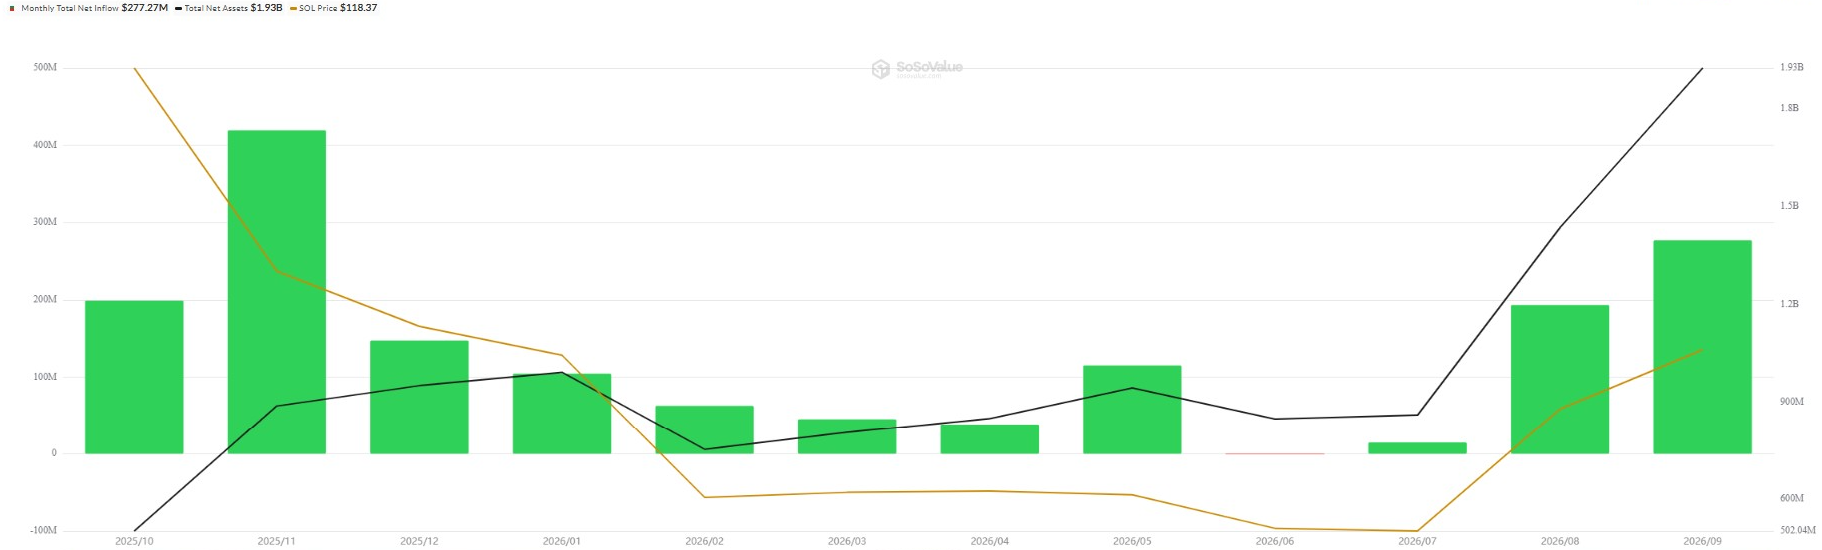
Since July 13, those products have accumulated roughly 4.37 million SOL worth around $450 million, according to the SoSoValue data. That ETF accumulation provides a broader demand backdrop. Even so, the immediate setup continues to depend on Tuesday’s close and sustained acceptance above $118.89.
LEVELS THAT DEFINE THE SETUP
| Level | Role |
| $124.13 | Buy-side liquidity and continuation reference |
| $122.93 | Monday’s high and first upside draw |
| $118.89 | CISD confirmation level |
| $117.26 | Monday’s range low |
| $116.45 | Order block and downside reference |
EXPANSION CASE
A Tuesday close inside Monday’s range while $118.89 holds would preserve the manipulation setup. That would keep $122.93 first, with $124.13 becoming the next reference if Monday’s high breaks.
FAILURE CASE
A sustained reversal below $118.89 would weaken the reclaim and reduce the strength of the immediate bullish setup. Moreover, if SOL loses $117.26, attention would shift back toward the $116.45 order block.
BOTTOM LINE
Tuesday’s sweep below $117.26 and rebound from $116.45 created the potential range-manipulation structure shown on the one-hour chart. Yet, confirmation still requires a close inside Monday’s range and continued acceptance above $118.89. If those conditions hold, $122.93 remains the first target before $124.13 becomes the next liquidity reference into Wednesday.
FAQs
A close inside Monday’s range while $118.89 holds provides confirmation rather than anticipation.
Monday’s $122.93 high is the first major draw.
The chart marks buy-side liquidity at $124.13 above Monday’s high.
A move below $118.89 weakens the reclaim, while a move below $117.26 redirects attention toward $116.45.
They show roughly 4.37 million SOL worth about $450 million accumulated through U.S. spot products since July 13.
Related: Ethereum Price LIVE: Liquidity Shakeout Could Fuel Short Squeeze to $2,789
Disclaimer: The information presented in this article is for informational and educational purposes only. The article does not constitute financial advice or advice of any kind. Coin Edition is not responsible for any losses incurred as a result of the utilization of content, products, or services mentioned. Readers are advised to exercise caution before taking any action related to the company.