


- SOL has been struggling throughout the week while residing in the red zone.
- The gradient of SOL reduces when it moves into the red rising wedge.
- A slight variation in prices alters the RSI with a great magnitude, another surge could be on the cards.
For the previous week, Solana (SOL) has experienced difficulty getting started. The token was fluctuating mostly in the red zone while very rarely bobbing above its opening market price. SOL was priced at $24.9 when the markets opened for trading, just a few hours into the first day of the week SOL tanked to the red zone as shown below.
Although the token gradually descended at the beginning, towards the second half of the first day, it plummeted. SOL fell from $24.34 to $22.41 within a few hours. However, on the second day of the week the token gained some momentum and started reaching higher highs in the red zone. With more momentum from the bulls, SOL was able to make three crests in the green zone.
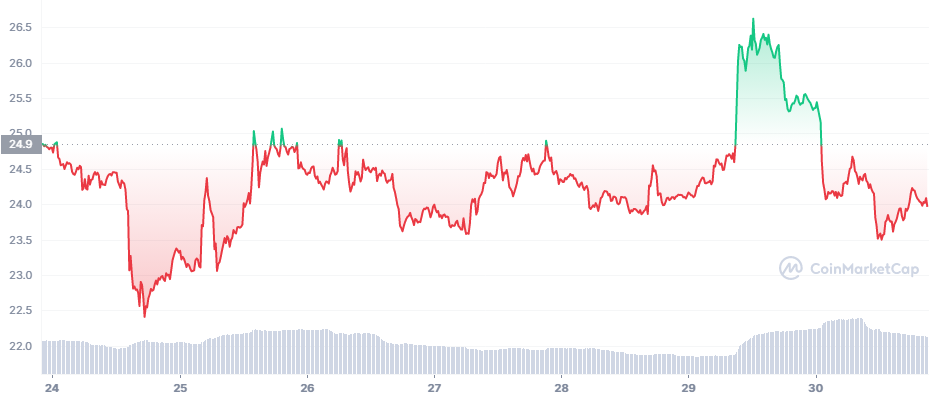
Nonetheless, the bears were too strong for the bulls, as such, the token tanked into the red zone again. However, the bulls did not let the bears off the hook. Hence, SOL fluctuated in the $23.5-$25 price range up until the sixth day. But with the buying pressure building, SOL was able to break the shackles and rise into the green zone.
During its short stay in the green zone, the token reached a maximum price of $26.62. Following its brief stay in the green zone, SOL lost the battle to the bears again and tanked into the red zone. Currently, SOL is down 6.19% in the last 24 hours and is priced at $23.97.
As shown in the chart below, SOL has been making higher-lows since late December. When comparing the higher-lows in the blue dotted lines against the ones in the red dotted lines, it could be seen that the gradient of the red line is quite less. This shows that the bulls are exhausted and the bears seem to be creeping in.
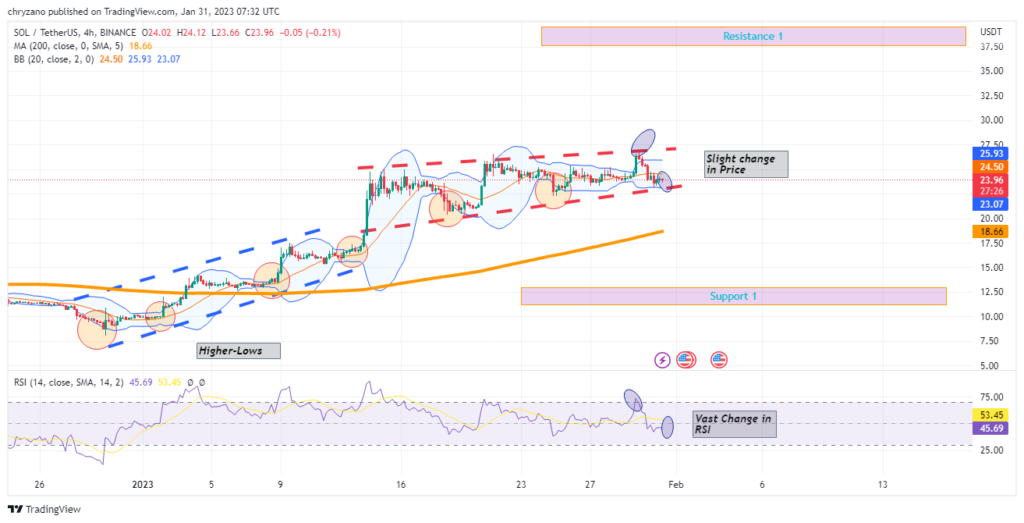
Notably, after reaching $25.92, the market corrected SOL as it hit the upper Bollinger band. As of now SOL is trading at $23.97. When the market corrected SOL by a minute figure, the RSI moved by a large margin. In particular, the RSI moved from 72.12 to 45.20.
Moreover, when considering the other occasions when the RSI shifted by a large margin as a result of a slight correction in price, SOL surged. However, the Bollinger bands are facing sideways depicting the prices could consolidate.
But the question is, are the Bollinger bands contracting as they have in the past before broadening in anticipation of a price surge? On the other hand, SOL is fluctuating in a bearish rising wedge, hence the prices could tank to support 1.
If the prices are to tank then traders should consider shorting their assets as they could buy it back at a lower price and make profit. However, if the opposite is to happen and then the long position traders should hold or buy more SOL, as the resistance 1 has some lucrative profits to offer.
Disclaimer: The views and opinions, as well as all the information shared in this price analysis, are published in good faith. Readers must do their own research and due diligence. Any action taken by the reader is strictly at their own risk, Coin Edition and its affiliates will not be held liable for any direct or indirect damage or loss.
Disclaimer: The information presented in this article is for informational and educational purposes only. The article does not constitute financial advice or advice of any kind. Coin Edition is not responsible for any losses incurred as a result of the utilization of content, products, or services mentioned. Readers are advised to exercise caution before taking any action related to the company.


