





- SOL trades at $76 on August 18, compressing inside a symmetric triangle nearing its September breakout point
- Solana pulled in $254M in RWA net inflows over 30 days, the most of any blockchain
- Solana processed $45.6B in DEX volume over 30 days, the most of any chain, ahead of BNB Chain at $38B
The SOL price prediction points to a narrowing range as price coils inside a symmetric triangle that has been building since June, with the apex now approaching early September. That technical squeeze comes as Solana posts two separate leadership numbers this week, topping both real world asset inflows and decentralized exchange volume across every blockchain tracked.
Solana Price Analysis: Triangle Apex Approaches as Fib Levels Cap the Range
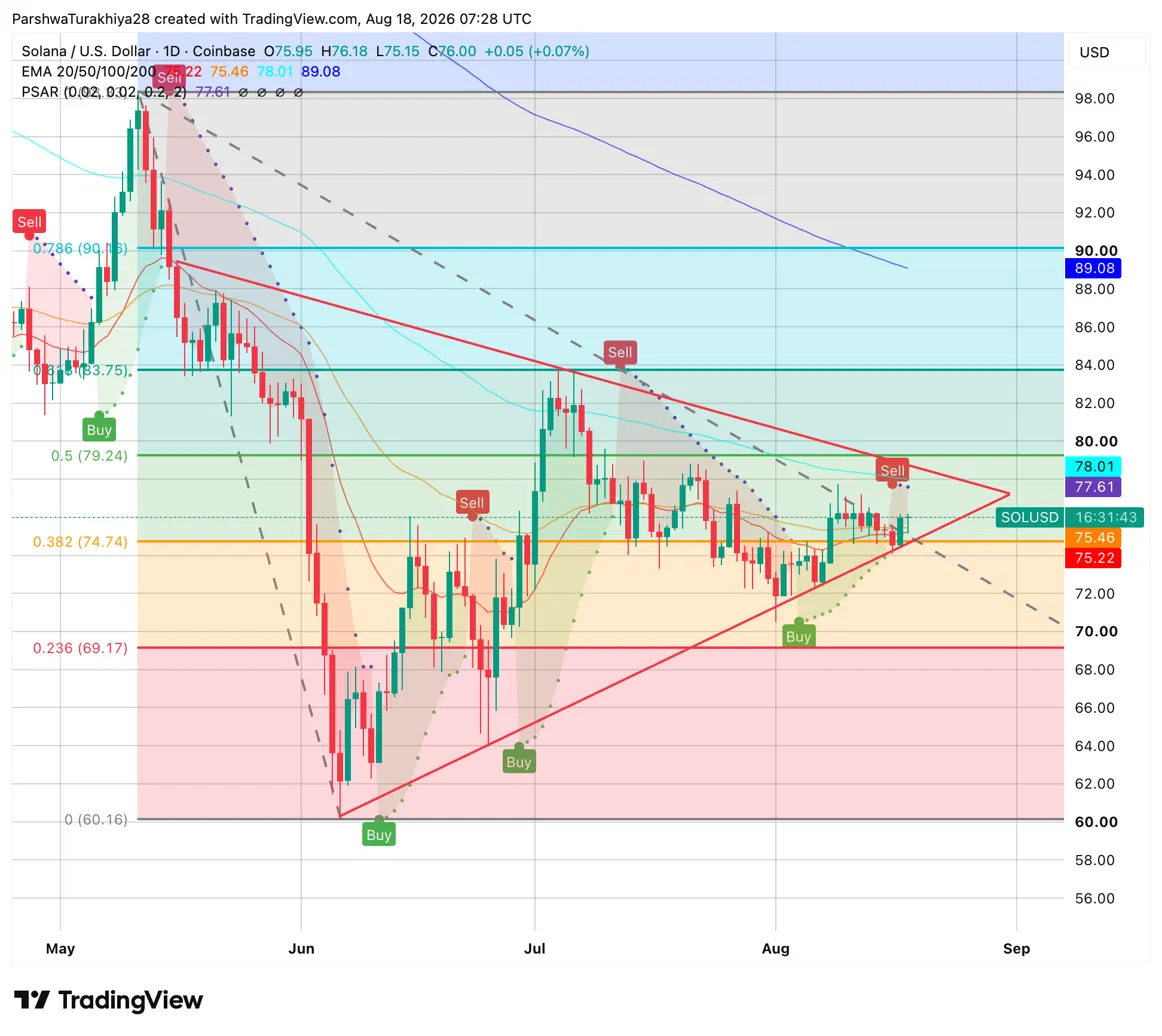
SOL has been carving out a symmetric triangle since the June low near $60.16, with higher lows on one side and lower highs from the July peak on the other. The two lines are converging fast, putting a breakout somewhere in the first half of September.
Price is currently boxed between two Fibonacci levels, support at $74.74 and resistance at $79.24. The Parabolic SAR at $77.61 sits just overhead and stays bearish until price closes above it. The 20-day EMA at $75.22 and 50-day EMA at $75.46 sit just below price and have flattened out, while the 100-day EMA at $78.01 lines up with the triangle’s resistance line, making $77.61 to $79.24 the zone buyers need to clear.
Related: PI Price Prediction Holds Steady At $0.086 As Pi Network Overhauls App Economy
A break above that zone opens the path toward $83.75. A break below $74.74 exposes $69.17 as the next support.
SOL Support and Resistance Levels, August 18, 2026
| Type | Price | Level |
| Resistance | $78.01 | 100-day EMA |
| Resistance | $79.24 | 0.5 Fibonacci retracement |
| Resistance | $83.75 | 0.618 Fibonacci retracement |
| Support | $75.46 | 50-day EMA |
| Support | $74.74 | 0.382 Fibonacci retracement |
| Support | $69.17 | 0.236 Fibonacci retracement |
Solana News: SOL Tops Every Chain in RWA Net Inflows
Solana ranked first among all blockchains in real world asset net inflows over the past 30 days, pulling in $254M as of August 17, according to data shared by SolanaFloor. Stellar followed closely in second at $228M, while Monad, Base, and Polygon rounded out the top five with smaller but still positive inflows.
The picture looked very different on the other end of the table. Ethereum posted the largest outflow at $298M, followed by BNB Chain at $277M and Provenance at $115M. Avalanche and Arbitrum also saw money leave, though at smaller scale. The split shows RWA capital actively rotating toward Solana and Stellar while pulling back from larger, more established chains.
Solana News: SOL ETFs Post Best Week Since May
Solana linked ETFs attracted $10M last week, their strongest week since May, according to Wintermute. XRP and Hyperliquid products also posted modest inflows, while selling pressure stayed concentrated in Bitcoin funds.
Wintermute noted this matches select token demand it flagged two weeks earlier, though cautioned the current size still reflects early interest rather than a confirmed flow trend.
Solana News: SOL Leads All Chains in DEX Volume, Robinhood Chain Debuts in Top Five
Solana recorded $45.6B in DEX volume over the past 30 days, the most of any blockchain, according to DefiLlama. BNB Chain held second at $38B after overtaking Base in June and Ethereum in July. Ethereum slipped to third at $24.2B, with Base fourth at $17.9B. Solana and BNB Chain alone now account for more than $83B in monthly spot trading volume, well clear of the rest of the field.
Related: Venice Token Price Prediction: VVV Eyes $15 as Revenue Surges Past $100 Million
The bigger surprise was Robinhood Chain debuting in fifth place at $14.1B, ahead of both Polygon and Hyperliquid’s own Layer 1. The network only went live on July 1 and processed $3.1B in its first week, according to Bernstein. It already has over 65,000 users holding roughly $13M in tokenized stocks and $300M in stablecoins. Bernstein called it central to Robinhood’s push into tokenized equities and real world assets, built on Arbitrum’s Layer 2 stack and aimed at Robinhood’s 27 million funded accounts across more than 120 countries.
| Chain | 30-Day DEX Volume |
| Solana | $45.6B |
| BNB Chain | $38B |
| Ethereum | $24.2B |
| Base | $17.9B |
| Robinhood Chain | $14.1B |
SOL Price Prediction: Upside and Downside Targets
Bullish Case, Target: $83.75 (0.618 Fibonacci Level)
SOL clears the $77.61 to $79.24 resistance zone on a daily close, flipping the Parabolic SAR bullish and breaking above the triangle’s descending resistance line. Continued RWA inflow leadership and a building ETF flow streak add fundamental support, while the DEX volume lead reinforces Solana’s position as the most active trading chain. A confirmed breakout opens the path toward the 0.618 fib level at $83.75.
Bearish Case, Risk Level: $69.17 (0.236 Fibonacci Level)
SOL loses the ascending triangle support and the $74.74 to $75.22 EMA cluster on a daily close, confirming a breakdown from the pattern instead of a breakout. ETF inflows fail to build on last week’s improvement and revert to outflows, while broader RWA and DEX volume leadership do little to offset weak price action. Price falls toward the 0.236 fib level at $69.17, retesting the lower half of the year’s trading range.
Conclusion
Solana’s fundamentals and its chart are telling two different stories at the moment, and that gap is worth sitting with rather than resolving too quickly. The fundamentals are unambiguous: Solana leads every tracked blockchain in both RWA inflows and DEX volume, and Robinhood Chain’s fast start adds another data point to the broader institutional interest building around the ecosystem.
The chart, by contrast, is still genuinely undecided, a tightening triangle with its apex just weeks away and no clear lean toward either side yet. The $77.61 to $79.24 zone is where that tension resolves: clear it and $83.75 comes into range on real fundamental support, lose the triangle’s lower boundary instead and $69.17 becomes the next real test regardless of how strong Solana’s usage numbers look.
FAQs
SOL trades at $76 inside a tightening symmetric triangle. The bullish case targets $83.75 at the 0.618 Fibonacci level, while the bearish case points to $69.17 at the 0.236 Fibonacci level if the triangle breaks lower instead.
Solana pulled in $254 million in real-world asset net inflows over the past 30 days, the most of any blockchain, while Ethereum, BNB Chain, and Provenance all posted outflows. That split shows institutional tokenization capital actively rotating toward Solana rather than staying on larger, more established chains.
Solana processed $45.6 billion in decentralized exchange volume over 30 days, more than any other blockchain and ahead of BNB Chain’s $38 billion. That level of trading activity reflects real usage of Solana’s network, a fundamental factor distinct from the price action itself.
Robinhood Chain is a new blockchain built on Arbitrum’s Layer 2 stack that launched July 1 and already ranks fifth in DEX volume at $14.1 billion. Its fast growth signals a major brokerage is actively building tokenized equity and stablecoin infrastructure, a trend that touches the same institutional demand Solana is capturing elsewhere.
Solana-linked ETFs logged $10 million in inflows last week, their best week since May, but analysts caution the current size still reflects early interest rather than a confirmed flow trend.
SOL has strong fundamentals working in its favor right now, including leadership in both RWA inflows and DEX volume, but the chart remains genuinely undecided inside a tightening triangle. This is not financial advice, so weigh the bullish and bearish cases above against your own research and risk tolerance.
Disclaimer: The information presented in this article is for informational and educational purposes only. The article does not constitute financial advice or advice of any kind. Coin Edition is not responsible for any losses incurred as a result of the utilization of content, products, or services mentioned. Readers are advised to exercise caution before taking any action related to the company.




